Figures & data
Fig. 1. Arkhangelsk Oblast location and AO districts by groups. Districts where ticks were collected are in bold font (Designed in ArcGIS 9.3).
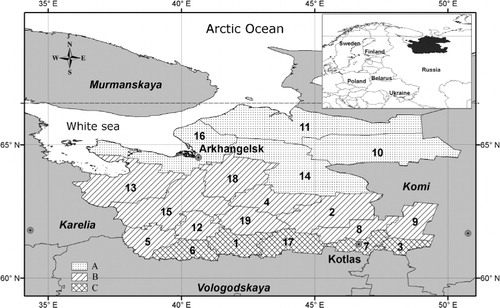
Table 1. The list of meteorological stations in AO
Table 2. Census data on the AO population Citation6
Fig. 2. (A) BIR10 in AO averaged over each decade: 1 <10; 2 10–100; 3 100–1000; 4 >1,000. (B) TBE incidence rate in AO averaged over each decade: 1 0.0–0.1; 2 0.1–1; 3 1–10; 4 10–100.
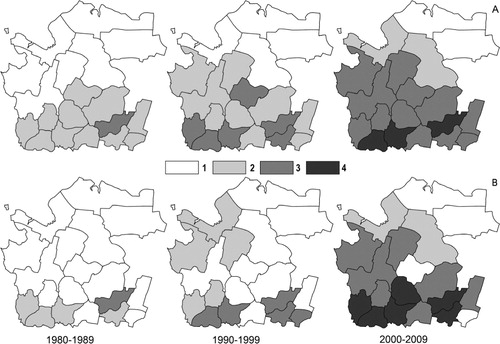
Table 3. BIR10and the length of tick bite reporting period for groups of AO districts
Fig. 3. TBE incidence in AO and in Russia as a whole in 1980—2009.
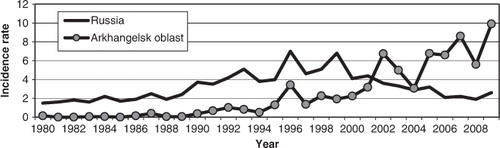
Table 4. Comparison of mean for decades TBE incidence rate in Russia and in AO
Fig. 4. Mean annual temperatures (1960–2009) and TBE incidence rates in AO (1980–2009).. Note: AO temperature data for 1971 and 1972 are not available.
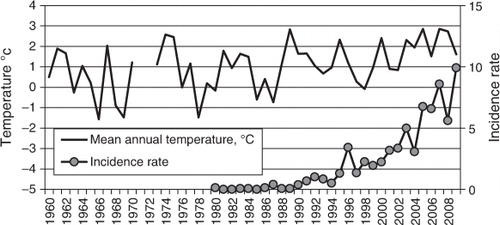
Fig. 5. Mean annual temperatures (1960–2009) and TBE incidence rates (1980–2009) in the (A) southern; (B) central; (C) northern group of AO districts. Note: AO temperature data for 1971 and 1972 are not available.
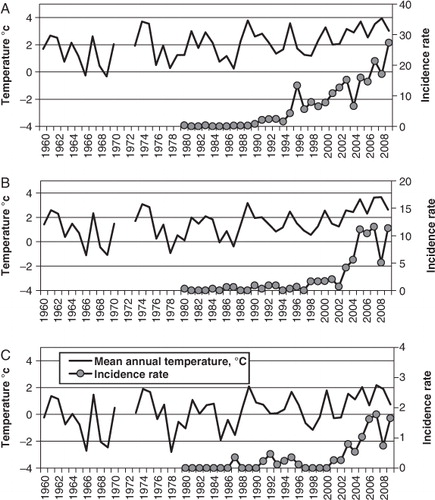
Table 5. Correlation analysis of the mean annual AO air temperatures and TBE incidence in AO during 1990–2009
Fig. 6. The results of regression analysis of TBE incidence and mean annual air temperatures in AO in 1980–2009.
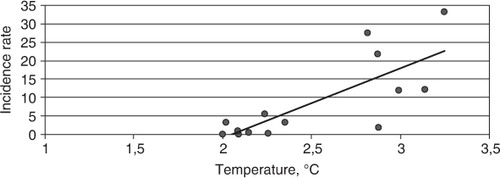
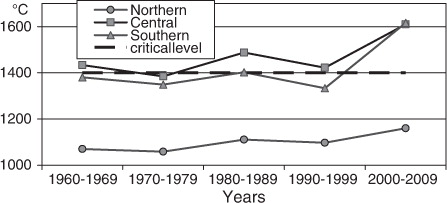
Fig. 7. Sums of annual effective temperatures exceeding 10°C averaged over decades for northern, central, and southern groups of AO districts.