Figures & data
Table 1. Summary statistic for systolic and diastolic blood pressure in mmHg, measured with mercury and electronic devices at four different times (T1–T4)
Fig. 1. Bland–Altman plots of the blood pressure differences between each possible pair of device-operator combination: (a) diastolic pressure and (b) systolic pressure. The solid horizontal line indicates the mean difference between the measures, the dashed horizontal lines indicate the 95% limits of agreement.
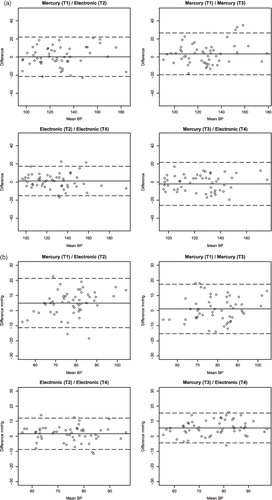
Fig. 2. Ogives showing the proportion (y-axis) of blood pressure measures with an absolute difference of no more than a certain pressure (x-axis) for three of the four possible pairs of device-operator combinations.
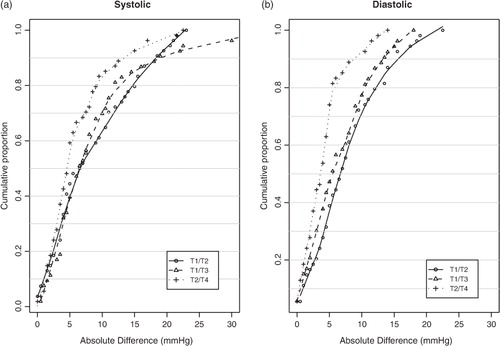
Table 2. The null, full and reduced, mixed-effects linear models of blood pressure measurement