Figures & data
Table 1. Distributions of the participants in the Västerbotten Intervention Programme from 1990 to 2007
Fig. 1. Prevalence of hypertension (%) among adults aged 40, 50, and 60 years in the Västerbotten Intervention Programme,1990_2010.
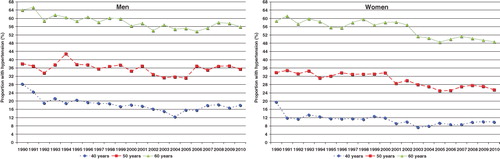
Fig. 2. Levels of (a) systolic blood pressure (mmHg); (b) diastolic blood pressure (mmHg); and (c) prevalence of hypertension (%) among adults across educational groups in the Västerbotten Intervention Programme, 1990–2010. Levels are adjusted for age.

Fig. 3. Prevalence of hypertension (%) in the Västerbotten Intervention Programme, 1990–2010, between geographic areas. The levels are adjusted for age and educational level. The graphs represent two-year moving averages.
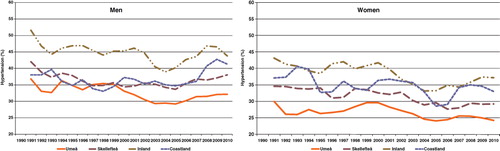
Table 2. Mean prevalence, awareness, treatment, and control of hypertension among adults in the Västerbotten Intervention Programme. The values are adjusted by age and year of examination
Fig. 4. Proportions of individuals who reported taking blood pressure-lowering treatment in the Västerbotten Intervention Programme, 1990–2010. Proportions are adjusted for age and sex.
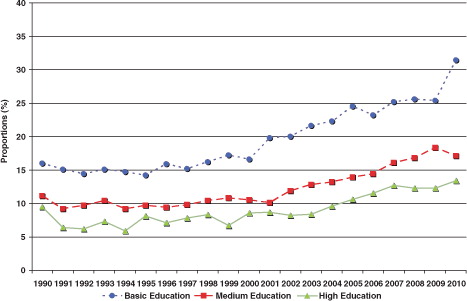
Fig. 5. Proportions of men and women who reported use of blood pressure lowering treatment and reached treatment goals in the Västerbotten Intervention Program, 1990–2010. Proportions are adjusted for age and sex.

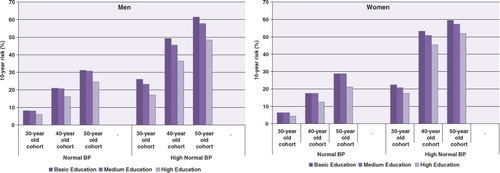
Fig. 6. Ten-year risk of developing hypertension among participants in the Västerbotten Intervention Programme. Risk is presented as a function of age at the start of the 10-year period and education, stratified by baseline blood pressure.
Appendix 1. Calibration for conversion of sitting to recumbent blood pressure values and vice versa.
In the Västerbotten Intervention Programme (VIP), blood pressures were measured with participants in a recumbent position until 1 September 2009. After that date, measurements were taken with participants in a seated position. The calibration process was done separately for men and women in each age-cohort. A total of 648 participants were selected from 25 of the 40 primary health care centres, represent the whole county and included both urban and rural areas. Two blood pressure measurements were taken in each recumbent and seated position. The first measurement was done after 5 min rest, and the second 5 min after the first one. The reading was done at the nearest 2 mmHg. The mean value of the two readings in each position was used for the validation. Readings with a difference between the values exceeding 30 mmHg in systolic blood pressure and 25 in diastolic pressure were excluded.