Figures & data
Fig. 1. Graphical representation of the three primary study components.
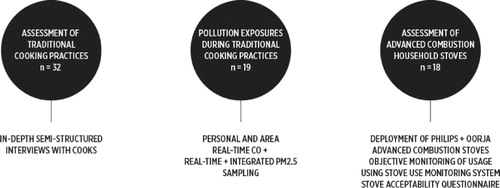
Fig. 2. Advanced stoves evaluated in Palwal, Haryana. (A) The Philips Woodstove Model HD4012. (B) The Oorja (photo courtesy First Energy, India). Both are manufactured in India.
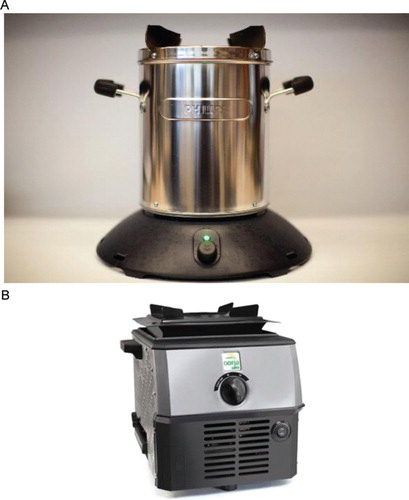
Fig. 3. Common traditional stoves found in homes in Palwal District, Haryana. (A) The traditional stationary hearth or chullah. (B) The portable hearth, or uthaao chullah, used during inclement weather under a covering or indoors. Both (A) and (B) are made of mud and plaster. (C) A top-loading, fixed hearth made of brick and mud or haroo. (D) A portable top-loading hearth or angithi. (C) and (D) are used for simmering items for long periods of time. (D) is used during inclement weather under a covering or indoors.
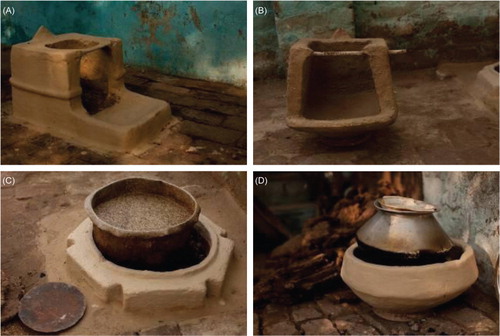
Fig. 4. PM2.5 concentrations across all study households, during a period of use of traditional stove (i.e. no use of advanced combustion stoves). Each box represents a separate subsample by location and monitoring approach. The height of each box is the interquartile range. The median concentration is marked with a solid black line. The mean concentration is marked by a diamond. The box whiskers extend to 1.5 times the interquartile range. Kitchen area and living area concentrations were measured for at least 1,440 min; personal concentration measurements were during cooking periods and lasted between 90 and 225 mins. Outdoor concentrations have been not depicted because of small sample size (n=3).
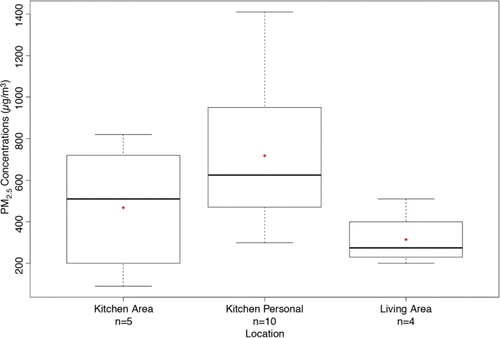
Fig. 5. Sample plots from (A) the Drager Pac7000 real-time carbon monoxide (CO) monitor and (B) the University of California Berkeley Particle and Temperature Sensor (UCB-PATS) logging data during cooking with a traditional stove. Note that peaks roughly correspond with cooking times from .
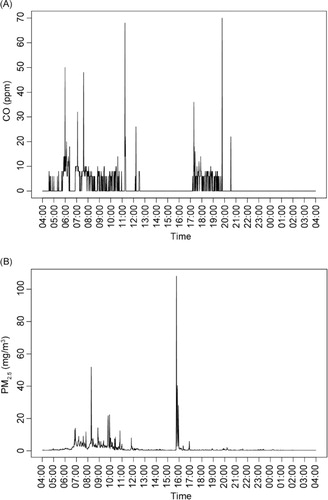
Table 1. Descriptive summary of 24-hour pollutant area concentrations by monitoring approach
Fig. 6. Typical daily use pattern for a stove use monitor in a house with the Philips Stove (A) and the Oorja stove (B). Peaks in the graphs represent cooking events.
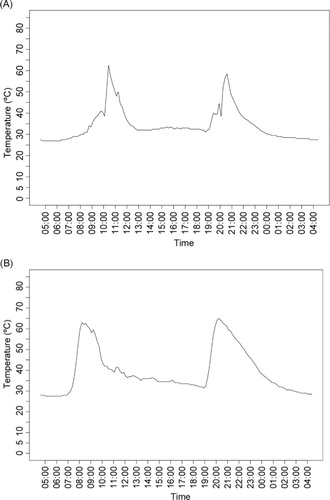
Fig. 7. Average use per day and hours of use over time by stove type. (A) shows the average number of uses per day of the Philips Stove versus the Oorja stove. (B) shows the changes in cumulative hours of use over each period. Note that both stoves start with high usage but then diverge, with both stoves being used, though at different levels. For both A and B, the length of the box is the interquartile range. The median concentration is marked with a solid black line. The mean concentration is marked by a diamond. The box whiskers extend to 1.5 times the interquartile range.
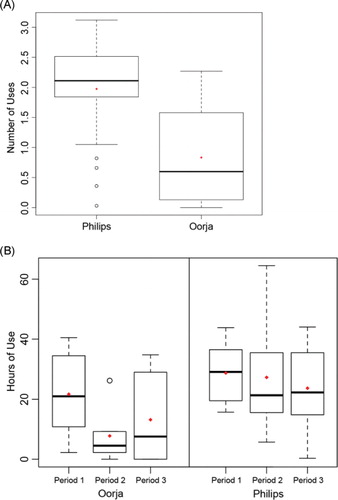
Table 2. Advanced stove usage over time by 4-week periods. Means with standard deviations of usage per day in hours and events per day are reported for 19 households