Figures & data
Fig. 1. Association of mortality with minimum, maximum and mean temperature, after adjusting for trend and seasonality.
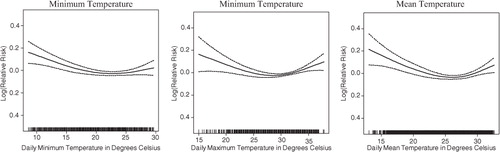
Table 1. Linear approximation of the association of mortality with minimum, maximum and mean daily temperature, after adjusting for trend and seasonality
Fig. 2. Association of mortality with mean temperature at different time lags, after adjusting for trend and seasonality.
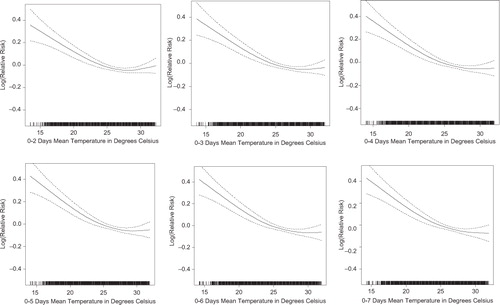
Fig. 3. Association of mortality with lag 0 and lag 1–5 mean temperature for different strata, after adjusting for trend and seasonality.
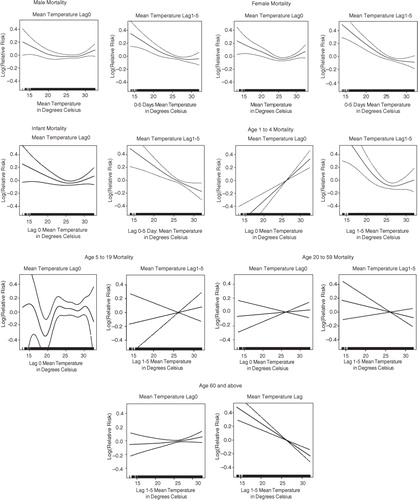
Table 2. Linear approximation of the association of mortality with mean temperature at different time lags, after adjusting for trend and seasonality
Table 3. Linear approximation of the association of mortality with combined lag 0 and lag 1–5 mean temperature for different strata, after adjusting for trend and seasonality
Fig. 4. Association of mortality with rainfall at different time lags, after adjusting for trend and seasonality.
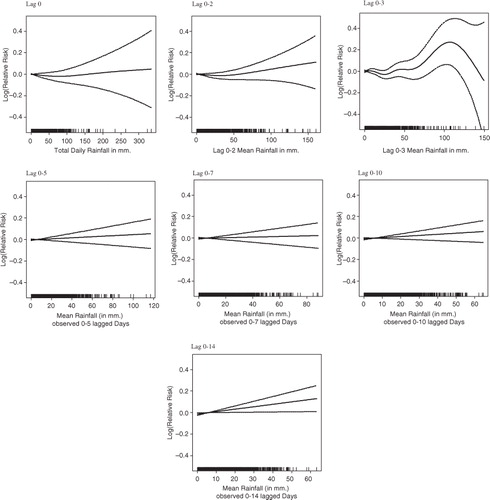
Fig. 5. Association of mortality with rainfall for different strata, after adjusting for trend and seasonality.
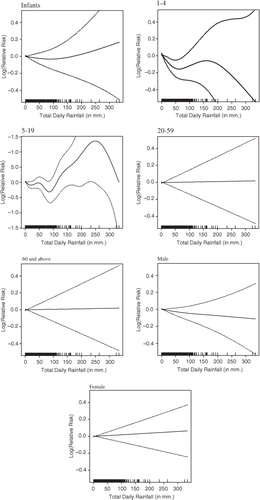
Table 4. Linear approximation of the association of mortality with rainfall at different time lags, after adjusting for trend and seasonality
Table 5. Linear approximation of the association of mortality with rainfall for different strata, after adjusting for trend and seasonality
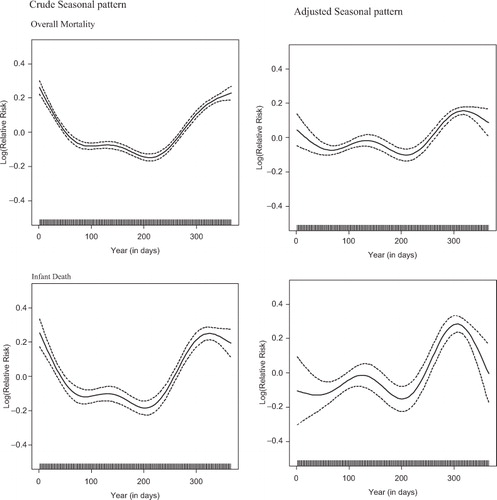
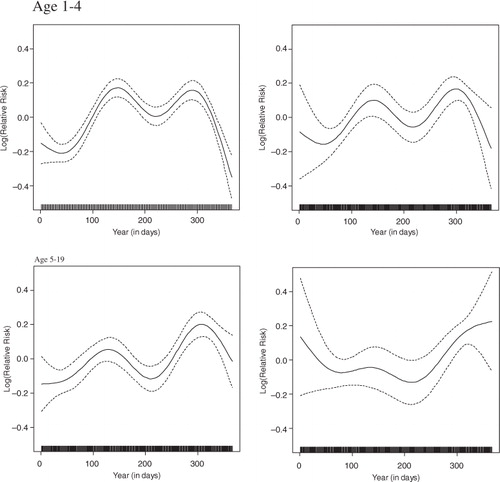
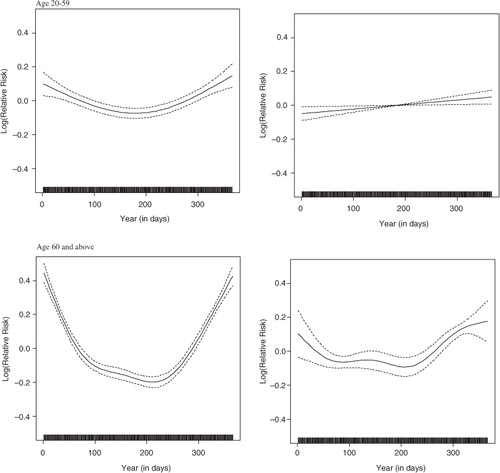
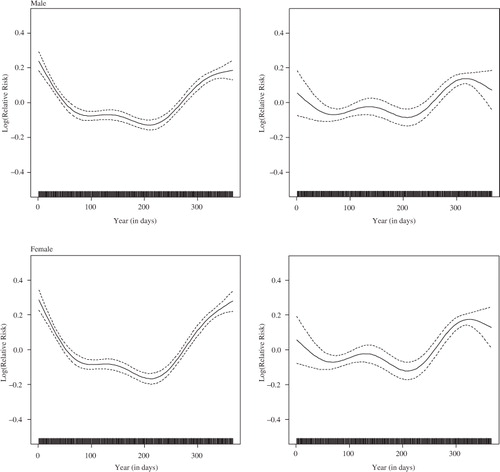
Fig. 6. Seasonality of mortality, adjusting for trend only, and adjusting for weather variables and trend.