Figures & data
Table 1. Cause of death profiles for the study period 2003–2008
Table 2. Distribution of mortality by age, gender, and cause of death
Fig. 1. Seasonal distribution of all-cause (weekly) mortality and temperature (°C).
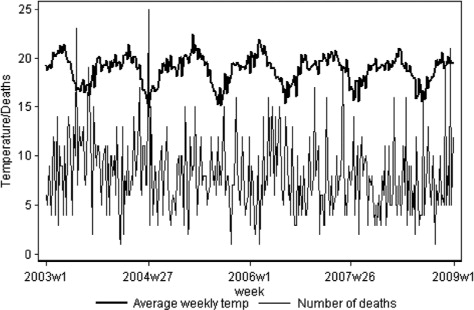
Fig. 2. Annual seasonal variation plots for all-age and under-five mortality. The vertical axes show the log (relative risk) and the horizontal axis show the month starting with January. Confidence intervals (95%) are shown as dotted lines.
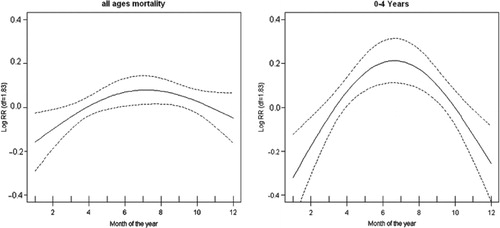
Fig. 3. Smooth functions of temperature for all and under-five mortality, and rainfall for all ages allowing lags of 0–13 days and 14–29 days. The vertical axes show the log (relative risk) and the horizontal axis show the scale of the explanatory variable. Confidence intervals (95%) are shown as dotted lines.
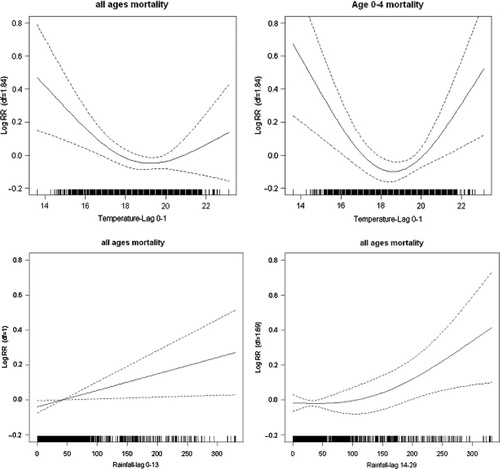
Table 3. Percentage change associated with 1°C decrease in temperature below 25th percentile, 1°C increase in temperature above 75th percentile and 25.4 mm (1 inch) increase in amount of rainfall
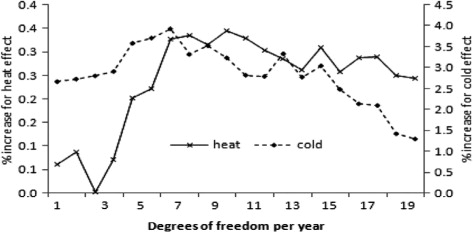
Fig. 4. Sensitivity analyses, with increasing degrees of freedom, of the percentage increase in mortality for an increase in temperature of 1°C at lag 0–1 days for both cold and heat effects. The left vertical axis shows the heat effect and right vertical axis shows cold effect in percentages.