Figures & data
Table 1. Summary statistics of daily mortality data by age and sex in the Kassena-Nankana Districts (KNDs) of Northern Ghana (1995–2010)
Fig. 1. Seasonal pattern in daily mortality, daily mean temperature and precipitation in the Kassena-Nankana Districts (KNDs) of Northern Ghana (1995–2010).
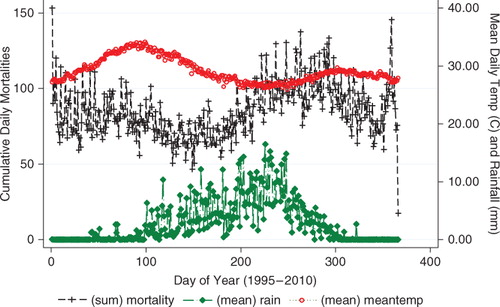
Table 2. Summary statistics of daily temperature and precipitation in the Kassena-Nankana Districts (KNDs) of Northern Ghana (1995–2010)
Fig. 2. Relative risks (RRs) of daily mortality among age and sex groups with daily mean temperature over lagged strata. Gray regions are corresponding 95% confidence intervals.
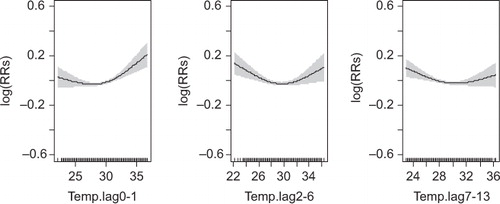
Table 3. Percent increase (95% confidence interval [CI]) for all cause daily mortality associated with 1°C increase in mean daily temperature
Table 4. Cumulative lag effect as a percent increase (95% confidence interval [CI]) for all cause mortality associated with 1°C increase in mean daily temperature
Fig. 3. Relative risks (RRs) of daily mortality among children under 5 years of age with daily mean temperature over lagged strata. Gray regions are corresponding 95% confidence intervals.
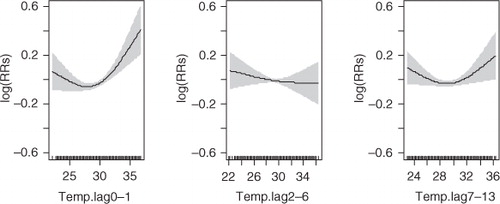
Fig. 4. Relative risks (RRs) of daily mortality among adults 60 years and above with daily mean temperature over lagged strata. Gray regions are corresponding 95% confidence intervals.
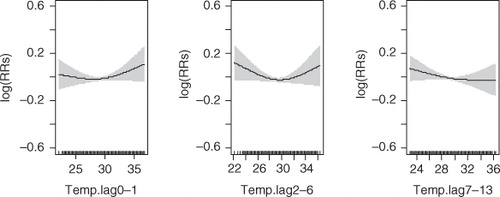
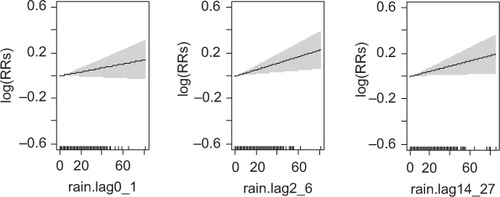
Fig. 5. Relative risks (RRs) of daily mortality among all age and sex groups with daily precipitation over lagged strata. Gray regions are corresponding 95% confidence intervals.
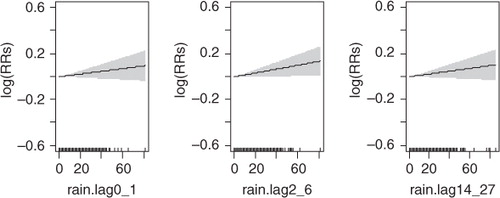
Table 5. Percent increase (95% confidence interval [CI]) for all cause daily mortality associated with 10 mm increased in precipitation
Fig. 6. Relative risks (RRs) of daily mortality among males with daily precipitation over lagged strata. Gray regions are corresponding 95% confidence intervals.