Figures & data
Fig. 1. Locations of the 12 INDEPTH member HDSSs evaluated in this study.
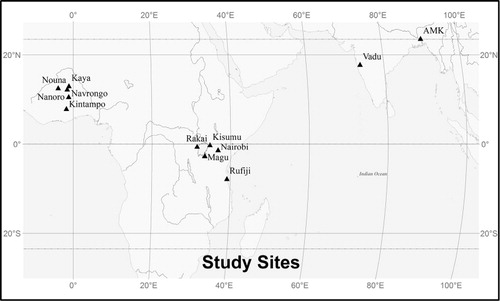
Table 1. Location of INDEPTH member sites and proximate meteorological stations
Fig. 2. Climate characteristics of Boromo, Burkina Faso, 2000–2009. (a) shows the temperature seasonality. The solid black line represents the mean monthly temperature. The upper and lower solid gray lines represent the mean monthly maximum and minimum temperature, respectively. The dashed gray lines represent the extreme monthly maximum and minimum temperature. (b) shows the precipitation seasonality with the average monthly precipitation (mm). (c) shows the precipitation seasonality based on the number of days with rainfall greater than 0.25 cm (black bars) and 2.5 cm (gray bars) per month.
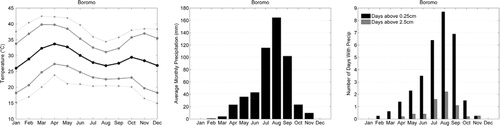
Fig. 3. Climate characteristics of Nairobi, Kenya, 2000–2009 as in .
Fig. 4. Climate characteristics of Vadu. India, 2000–2009 as in .
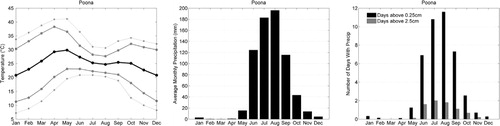
Fig. 5. Climate characteristics of Agartala, India, 2000–2009 as in .
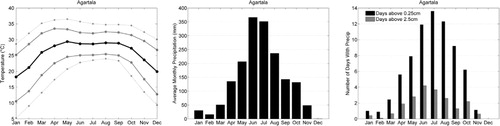
Fig. 6. Historical and projected future temperatures at four INDEPTH member sites. The black dots represent the mean decadal temperature for each decade of the 1900s based on the Climate Research Unit reanalysis record. The dashed line extrapolates the historical data to the start of the modeling period; a slope in the dashed line indicates a statistically significant linear trend from 1900–2000. The gray lines each show mean temperature projections for twenty-year intervals from the HADCM3 and CCSM3 models for three different climate change scenarios. All points are shown at the midpoint of the appropriate time interval.
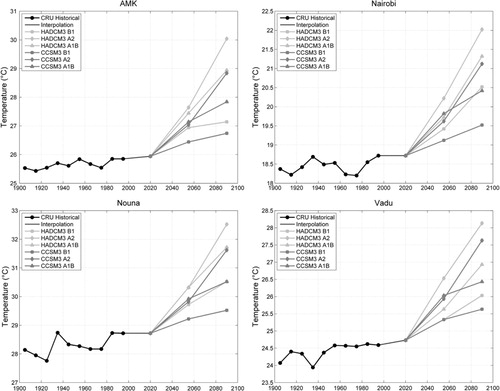
Fig. 7. Historical mean decadal minimum (left) and maximum (right) temperatures at four INDEPTH member sites, 1900–2000, based on CRU reanalysis data. A line is drawn for cases where simple linear regression indicated a statistically significant trend in the historical data. All points are shown at the midpoint of each decade.
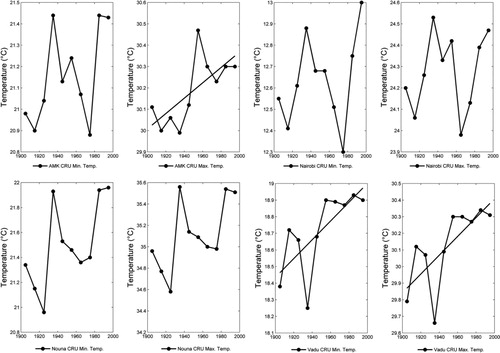
Fig. 8. Historical and projected future precipitation (mm per month) at four INDEPTH member sites, similar to .
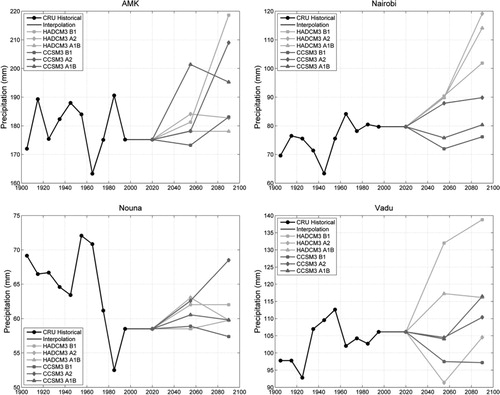
Fig. 9. Trends in historical climate characteristics by month at meteorological stations proximate to INDEPTH member sites. A bar is drawn in all cases where simple linear regression through the yearly time series data (1979–2011) indicated a significant trend: the bar height corresponds to the regression slope B. For each station, the panels show trends per month in (a) the number of days with precipitation >0.25 cm, (b) the number of days with precipitation above 2.5cm, (c) total precipitation, (d) extreme minimum temperature, (e) extreme maximum temperature, (f) mean minimum temperature, (g) mean maximum temperature, and (h) mean monthly temperature.
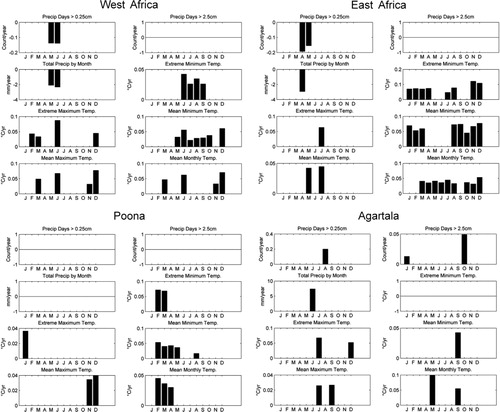
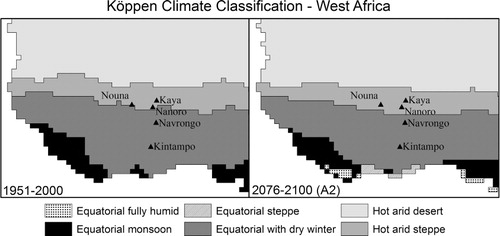
Fig. 10. Estimated Köppen climate classification types in West Africa for (a) the second half of the twentieth century and (b) the final 25 years of the 21st century projected with the Tyndall climate model and the A2 scenario.