Figures & data
Fig. 1. Pragati programme structure. It shows the organisation structure of the Pragati programme staff. Peer educators (PE) and outreach workers (ORW) make up the backbone of the Pragati project at field level. Each PE is responsible for 60–120 FSWs to whom she regularly provides outreach services and encourages visiting the Pragati drop-in centres. These PEs are supported by an ORW, who is responsible for day-to-day monitoring of the PEs, providing them handholding support when required, establishing condom outlets, and the management of secondary stakeholders in her assigned area. Each ORW is responsible for 6–7 PEs. The ORWs report to zonal field coordinators who are from the sex worker collective. A zonal manager supports the field coordinators. There is an overall field operations manager from the sex worker collective (Swathi Mahila Sangha) and a programme manager from the technical support agency (Swasti Health Resource Center) who jointly oversee the project. MEAL = monitoring, evaluation and learning.
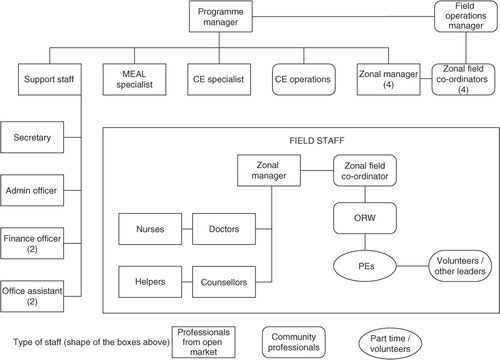
Table 1. STI treatment packs
Table 2. Characteristics of participating female sex workers over time (n = 20,330)
Fig. 2. Contacts with the programme over time. Bars represent the total number of contacts per year. Line represents the contact rate over time (contacts/person-year).
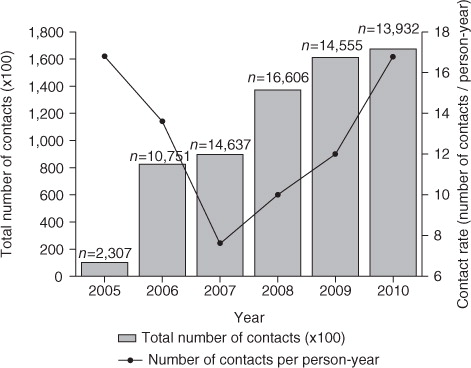
Table 3. Programme contacts over time
Fig. 3. Reported cases of violence against FSWs per year (2005–2010). Bars represent the total number of reported cases of violence against FSWs per year. Reporting period was 1 April–30 March of the next year.
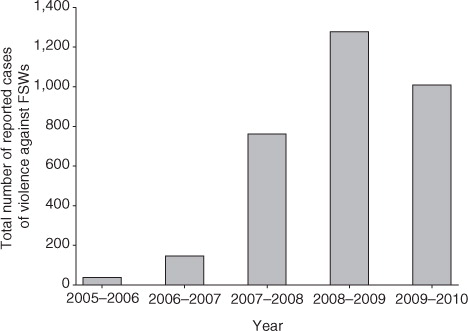
Fig. 4. Condoms distributed per year (2005–2010). Bars represent the total number of distributed condoms per year. Line represents the number of condoms distributed per person-year.
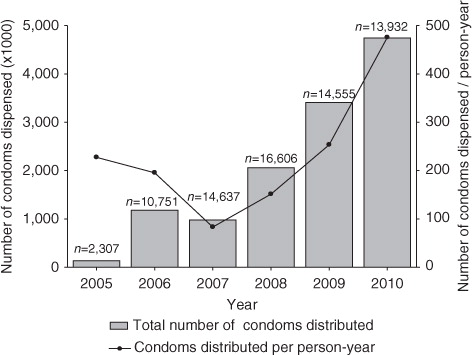
Fig. 5. Diagnosed STIs and STI incidence rate over time. Bars represent the total number of diagnosed STIs per year. Line represents the STI incidence rate over time (STI/person-year).
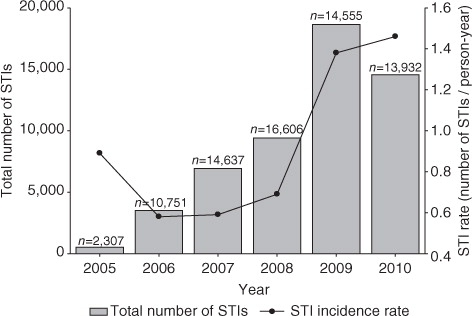
Table 4. Number of diagnosed STIs over time
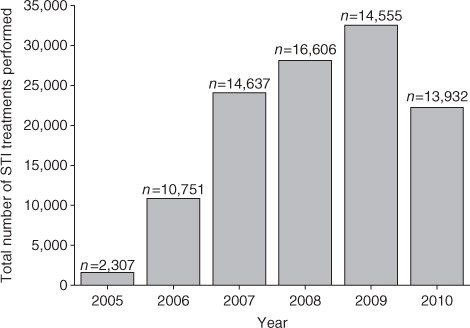
Fig. 6. Distributed STI treatment packages over time. Bars represent the total number of STI treatment packages that were distributed per year.