Figures & data
Fig. 1. Age-standardised prostate cancer mortality rates per 100,000 (Segi Standard).
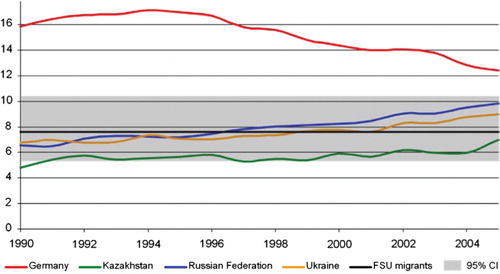
Table 1. Descriptive results of both migrant cohorts, from North-Rhine Westphalia and Saarland
Fig. 2. Overview of all 35 incident prostate cancer cases from the Saarland cohort sorted by age at diagnosis.
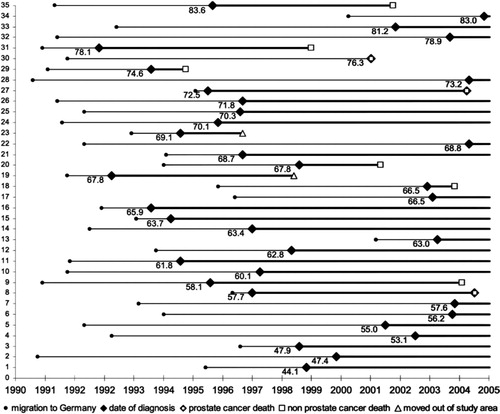
Table 2. Standardised incidence and mortality ratios of the migrant cohorts in comparison to the German resp. state of Saarland population
Table 3. Poisson regression analysis on prostate cancer incidence in comparison to the German population, state of Saarland