Figures & data
Table 1. Main characteristics of internal migrants aged 5 years and older in Vietnam, National Census, 2009
Table 2. Main characteristics of internal migrants aged 5 years and older, comprising 8.6% of the whole population, by migration flows and using Vietnam National Census data, 2009
Table 3. Main characteristics of interprovincial migrants aged 5 years and older, comprising 4.3% of the whole population (and 50.5% of the internal migration population), by migration flows and using Vietnam National Census data, 2009
Fig. 1. Trends of interprovincial migration rates (migrants per 1,000 people) over time by gender and age groups.
All proportions presented in this graph were estimated using census data with an extremely large sample size; the standard deviation of the proportion is extremely small (such as 0.007%) and the 95% CI extremely narrow, and thus the 95% CI was hardly presented in the chart.
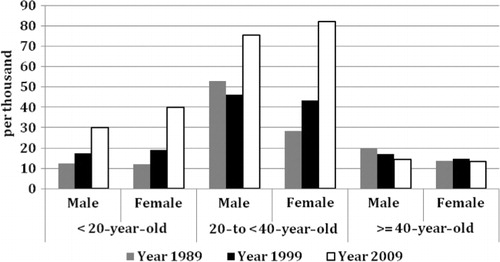
Fig. 2. In-migration rates and number of industrial zones by province in Vietnam, 2009, excluding Hoang Sa and Truong Sa islands. The map shows the number of industrial zones but does not show the extent of the industrial zones.
Note: Distribution of variables in this figure is skewed; thus, these variables are classified into categories by using the quintile.
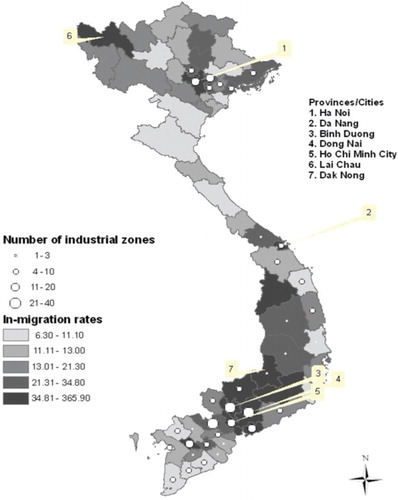
Fig. 3. Migration rates in Vietnam, 2009, excluding Hoang Sa and Truong Sa islands. Part A shows the in-migration rates by province, and part B shows the out-migration rates by province.
Note: Distribution of variables in this figure is skewed; thus, these variables are classified into categories by using the quintile.
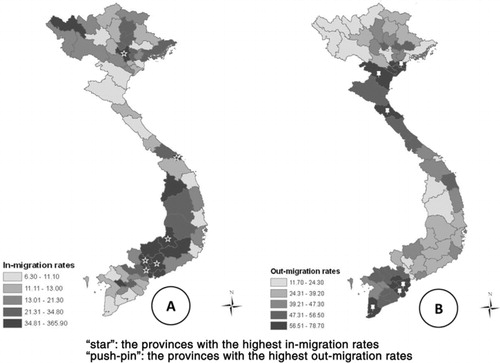
Fig. 4. The relation between migration and monthly income per capita in the Vietnamese population, excluding Hoang Sa and Truong Sa islands.
The ‘star’ symbols in the top northeast corner and the two ‘star’ symbols in the east middle show the Lai Chau, Kon Tum, and Dak Nong provinces, which are outliers with high in-migration rates and low monthly per capita income.
Note: Distribution of variables in this figure is skewed; thus, these variables are classified into categories by using the quintile.
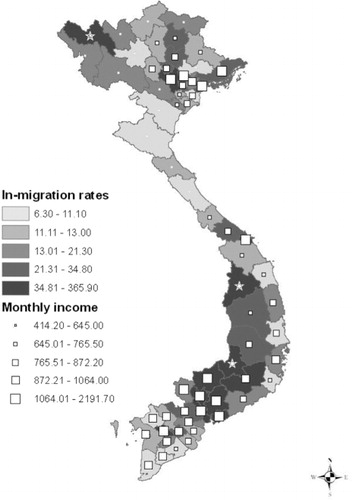
Table 4. Crude odds ratios of in-migration and its correlates