Figures & data
Fig. 1. Location of the study area – Hanoi, Vietnam.
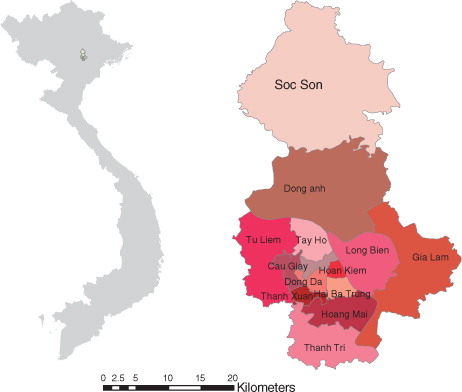
Table 1. Descriptive statistics of monthly numbers of postcode areas with notified dengue cases
Fig. 2. Numbers of dengue cases (____) and postcode areas with dengue notifications (-----) between January 2004 and December 2009 in Hanoi.
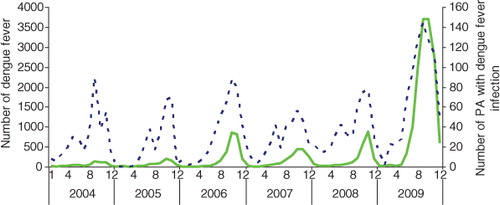
Fig. 3. Boxplots of the seasonal distribution of numbers of postcode areas with dengue infection in three periods in Hanoi. The boxplots display the values of the 25th, 50th, and 75th percentiles.
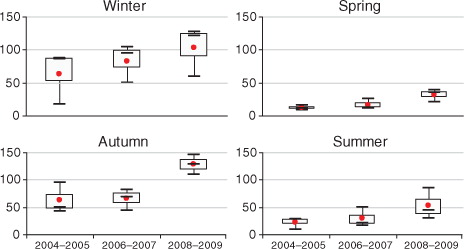
Fig. 4. Map showing raw dengue incidence rates in three periods.
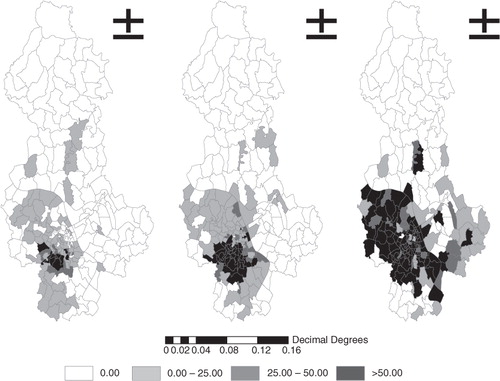
Table 2. Spatial autocorrelation analysis for dengue in Hanoi, 2004–2009
Table 3. The clusters of dengue cases detected using the purely temporal analysis
Table 4. The clusters of dengue cases detected using the purely spatial analysis
Table 5. SaTScan statistics for space–time clusters with significantly higher incidence in Hanoi from 2004 to 2009 (most likely cluster)
Fig. 5. Scatterplot of significant space–time clusters in Hanoi from 2004 to 2009.
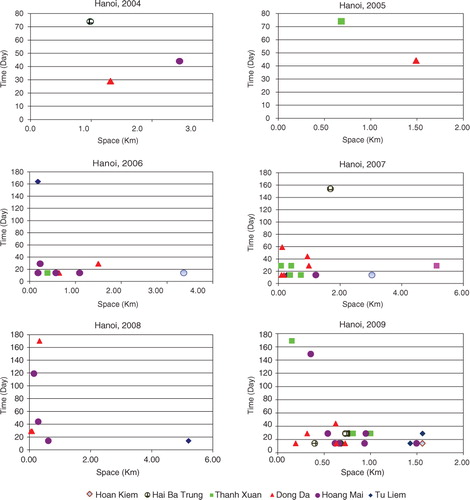
Table 6. Changes of dengue fever in latitude and longitude, Hanoi, 2004–2009