Figures & data

Fig. 1. Maps showing the location of the Agincourt HDSS Citation41.
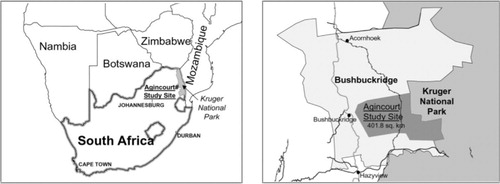
Table 1. Demographic profile of study sample by age group, 1992–2008
Table 2. Top five causes-of-death by age group, 1992–2008
Fig. 2. Age-specific mortality rates by year, 1992–2008.
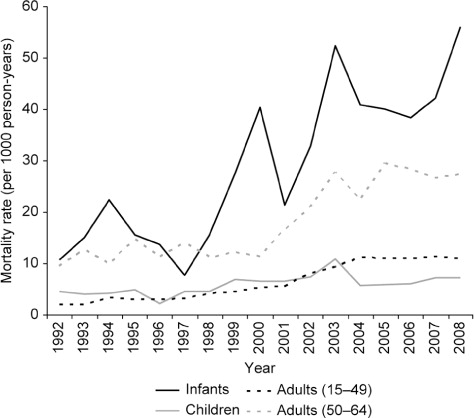
Table 3. All-cause multivariable risk factor analyses for age-specific mortality using Bayesian modelling
Fig. 3. Geographic risk of adult mortality adjusting for distance to nearest health facility at prediction point using a univariate Bayesian spatial kriging model that includes distance to health facility as the risk factor (white and black scale represents lowest and highest risk, respectively).
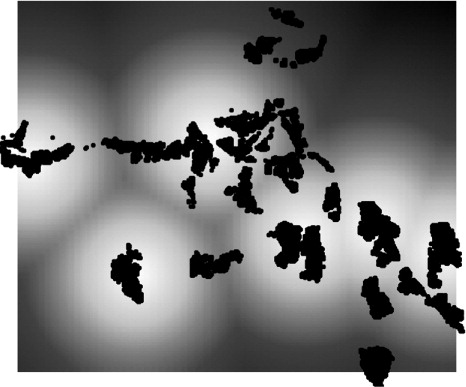
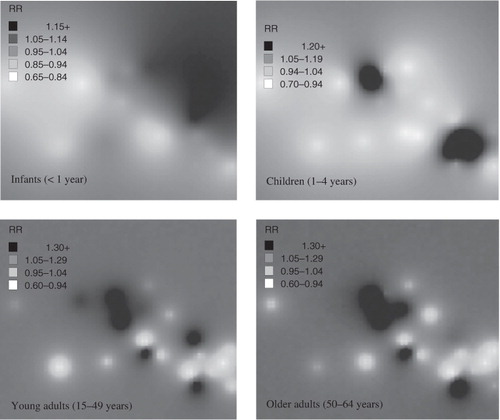
Fig. 4. Maps of all-cause mortality risk by age group within the Agincourt sub-district based on baseline Poisson model without covariates.