Figures & data
Fig. 1. Flow chart of HIV-infected children initiating ART at HSCC between 01 April 2004 and 30 April 2012.
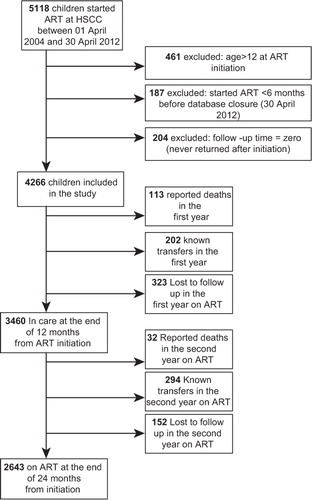
Table 1. Overall cohort characteristics at baseline (N=4,266) and at 12 months on treatment (N=3,640)
Fig. 2. Kaplan–Meier estimates of cumulative probability of LTFU by caregiver relationship during the first year and second year on ART.
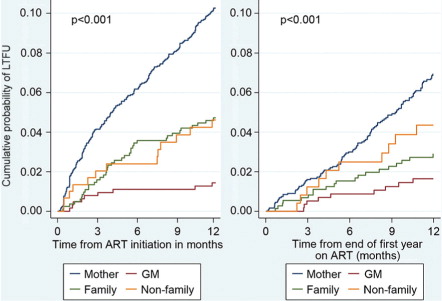
Table 2. Baseline characteristics associated with LTFU in the first year on ART
Table 3. The effect of 12-month characteristics on LTFU in the second year on ART
Table 4. Sensitivity analyses: LTFU in the first year
Table 5. Sensitivity analyses: LTFU in the second year