Figures & data
Table 1 Demographic data used in Spectrum file
Figure 1 HIV prevalence ages 15–49, by sex, Nairobi, 1990–2010, Spectrum model estimates.
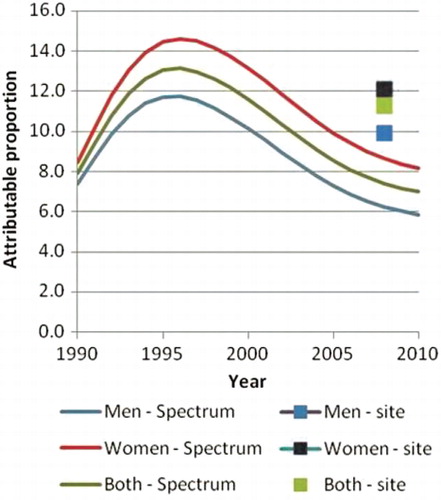
Figure 2 Adult age-specific mortality rates, all causes, both sexes, 2003–2010.
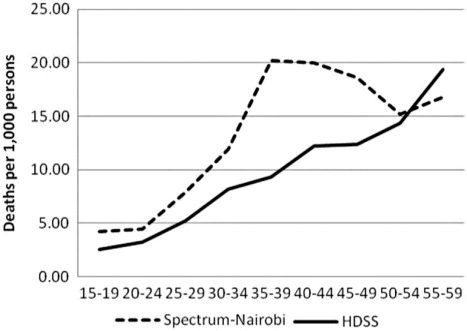
Figure 3 Adult age-specific mortality rates, all causes, by sex, 2003–2010.
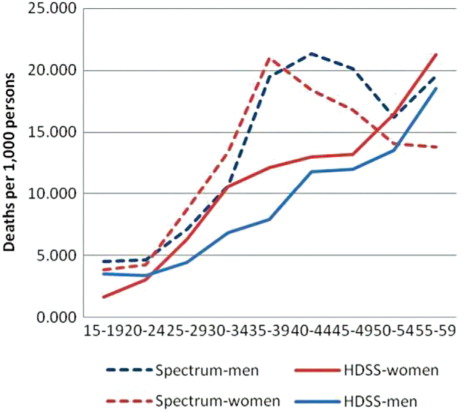
Figure 4 Adult age-specific mortality rates, all causes, both sexes, before and after roll-out of ART.
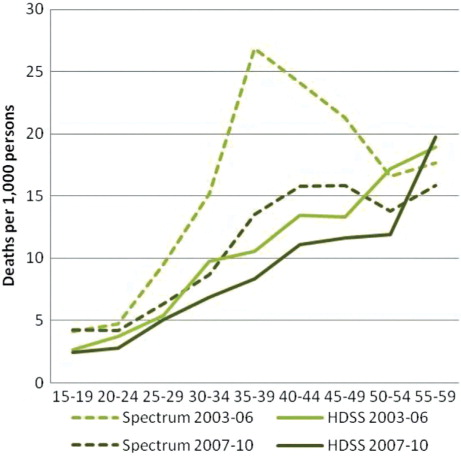
Figure 5 Percentage of AIDS-related deaths from Spectrum and AIDS- and TB-attributed deaths from InterVA, aged 15–59, Nairobi.
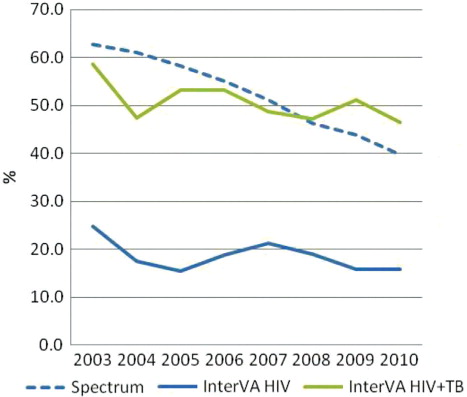
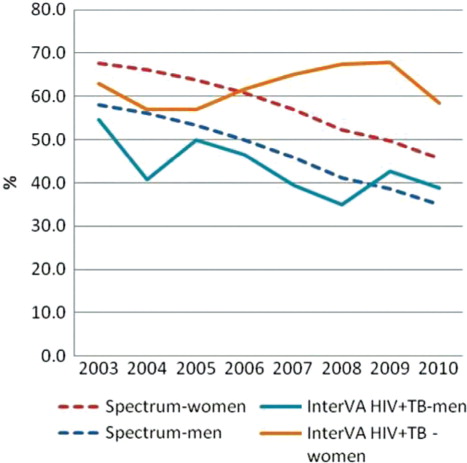
Figure 6 Percentage of AIDS-related deaths from Spectrum and deaths attributed to AIDS and TB from InterVA, by year and sex, aged 15–59, Nairobi.