
Figures & data
Table 1 Dates for the introduction of ART, the full rollout of ART, and the start of demographic surveillance and HIV serosurveys
Table 2 Classification of deaths and exposure time by HIV status
Table 3 Number of subjects and person years contributed to the analysis, mortality rate and period prevalence of HIV amongst persons with known HIV status, and the proportion of all deaths that were of individuals known to be HIV positive
Table 4 Age-standardized mortality rates (per 1,000 person years) by site, sex, HIV status, and ART phase: rates for HIV-negative people and PLWH, the excess mortality rate among PLWH (rate difference), and the standardized mortality ratio (SMR)
Fig. 1 Estimated excess mortality rate among PLWH by age, sex, and ART phase.
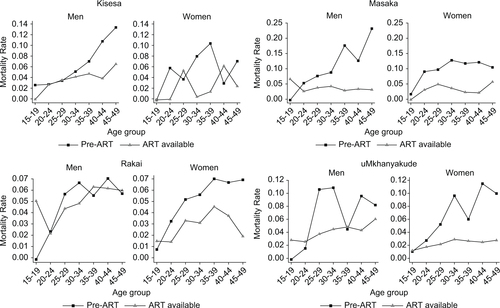
Fig. 2 Hazard ratios from an age-stratified exponential regression model comparing the mortality of PLWH to that of HIV-negative individuals, by ART availability. Estimates are controlled for sex and study site; these results are given in .
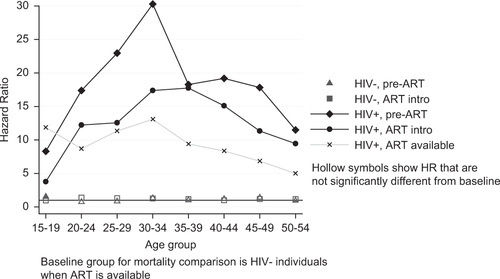
Table 5 Hazard ratios and 95% confidence intervals from an age-stratified exponential model comparing the mortality of PLWH and HIV-negative individuals by ART phase