
Figures & data
Table 1 Outpatient visits and telemedicine contacts in the period 2009–2011 in the four health regions
Table 2 Outpatient visits and telemedicine contacts in the period 2009–2011 in different clinical specialties
Table 3 Routine telemedicine services in different clinical fields
Table 4 Routine telemedicine services in different types of institutions
Table 5 Routine telemedicine services and year of establishment
Table 6 Routine telemedicine services at the five largest hospitals in Norway
Fig. 1 Comparison of telemedicine activity among different statewide networks. Closed symbols are non-Norwegian networks; the open symbol is Norway.
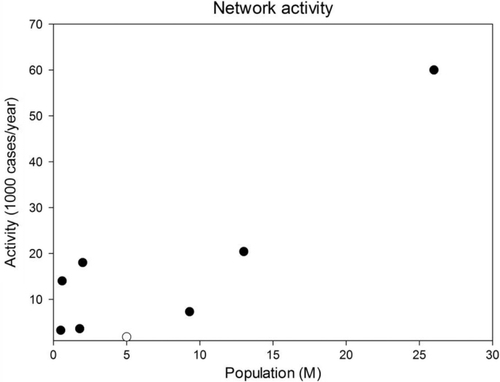
Table 7 Use of telemedicine in different statewide networks
Appendix 1 Outpatient visits and telemedicine contacts in the period 2009–2011 in the hospitals
Appendix 2 Numbers of clinical specialties delivering telemedicine in the hospitals