Figures & data
Fig. 1 Averaged notification rate of active TB during 2001–2010 in P. R. China.
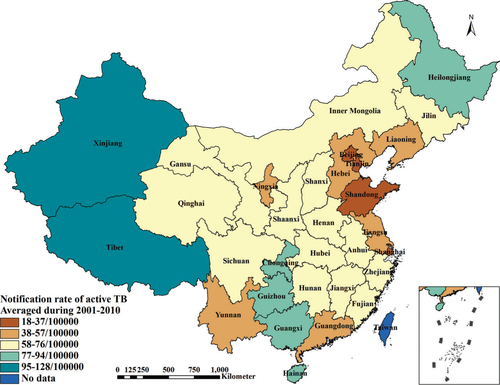
Table 1 Specification of observed and latent variables
Fig. 2 The partial least squares path model of TB prevalence with ecological factors.
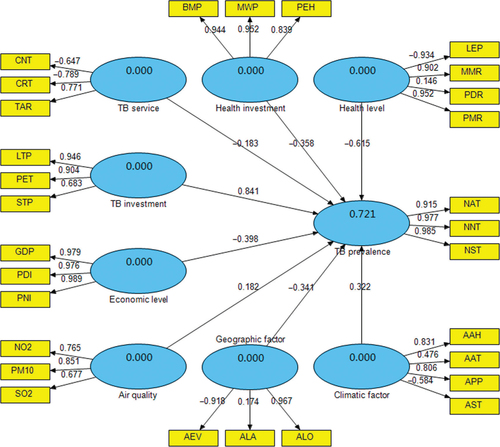
Table 2 Bootstrapping test of outer loadings in the partial least square path model
Table 3 Bootstrapping test of path coefficients in the partial least square path model
Table 4 Parameter estimates of the geographical weighted regression model
Fig. 3 Spatial heterogeneity for coefficients of TB investment impacting on TB prevalence (A1: coefficient; A2: standard error of coefficient).
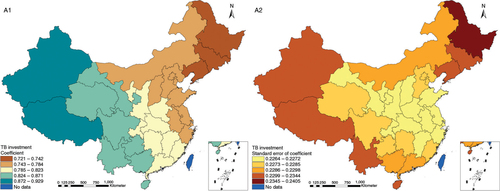
Fig. 4 Spatial heterogeneity for coefficients of TB service impacting on TB prevalence (B1: coefficient; B2: standard error of coefficient).
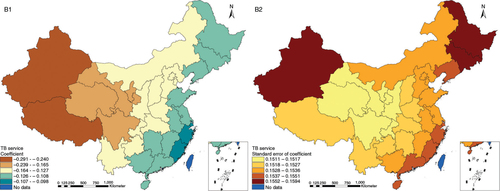
Fig. 5 Spatial heterogeneity for coefficients of health investment impacting on TB prevalence (C1: coefficient; C2: standard error of coefficient).
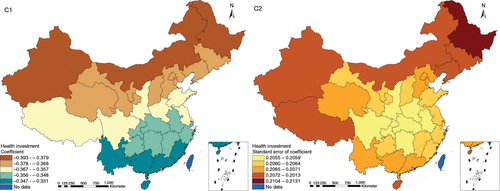
Fig. 6 Spatial heterogeneity for coefficients of health level impacting on TB prevalence (D1: coefficient; D2: standard error of coefficient).
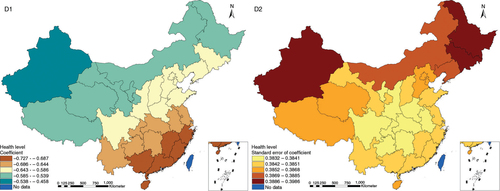
Fig. 7 Spatial heterogeneity for coefficients of economic level impacting on TB prevalence (E1: coefficient; E2: standard error of coefficient).
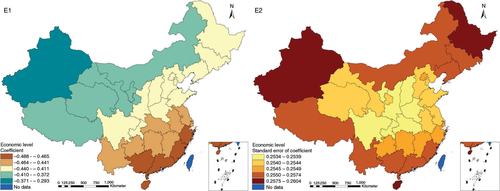
Fig. 8 Spatial heterogeneity for coefficients of air quality impacting on TB prevalence (F1: coefficient; F2: standard error of coefficient).
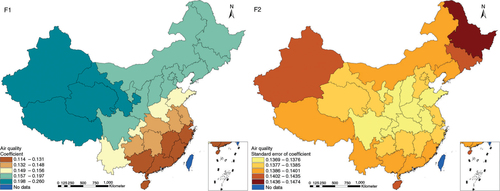
Fig. 9 Spatial heterogeneity for coefficients of climatic factor impacting on TB prevalence (G1: coefficient; G2: standard error of coefficient).
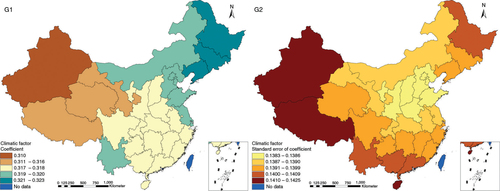
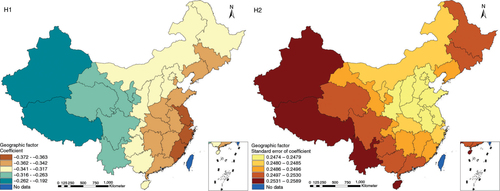
Fig. 10 Spatial heterogeneity for coefficients of geographic factor impacting on TB prevalence (H1: coefficient; H2: standard error of coefficient).