
Figures & data
Table 1 Doses of praziquantel in numbers of 600 mg tablets by height in cm according to the WHO dose-pole
Table 2 Mean values, standard deviations, coefficients of variation, minimum and maximum values for the variables age, weight and height among the 1,477 schoolchildren
Fig. 1 A scatter plot of height in cm and weight in kg for 1,477 schoolchildren with a correlation coefficient (r) of 0.9.
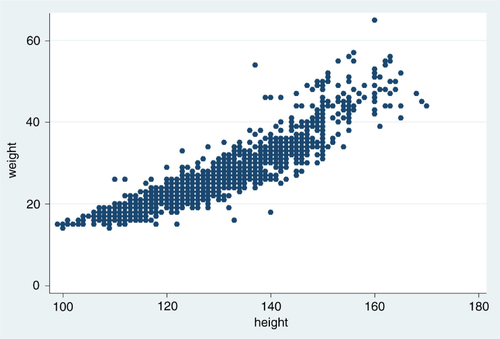
Fig. 2 Theoretical deviations in mg/kg according to body weight, illustrated by trajectories, when 40 mg/kg is the target dose and 300 mg tablet halves are used as the smallest dose unit.
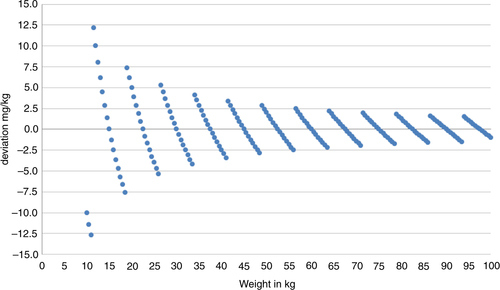
Table 3 Praziquantel doses according to weight applied to the weight range of 1,477 schoolchildren when tablet halves are used as the minimum segments
Fig. 3 Frequency weighted scatter plot with doses in number of pills from the dose-pole on the horizontal axis and number of pills by weight on the vertical axis with both the line of equality and the fitted line included.
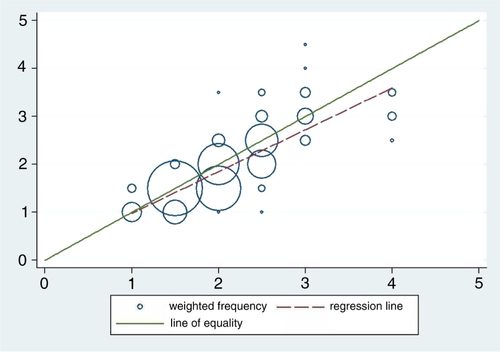
Fig. 4 Frequency weighted scatter plot of the differences in doses on the y-axis against the mean values of doses on the x-axis when comparing doses given by the dose-pole and doses using the weight approach. Reference lines included for mean differences as well as the limits of agreement.
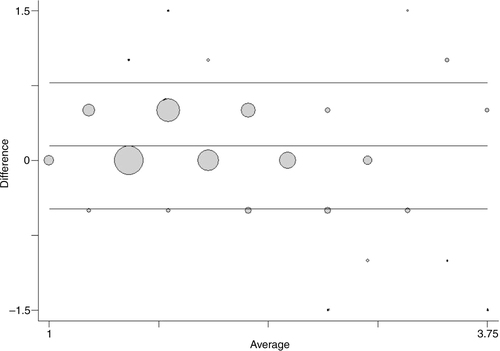
Table 4 Deviations in mg/kg from the target dose of 40 mg/kg, and number and percentage of children using the WHO dose-pole and the weight approach with tablet halves
Fig. 5 Dose by the dose-pole and dose by weight and tablet halves in mg/kg, all according to bodyweight.
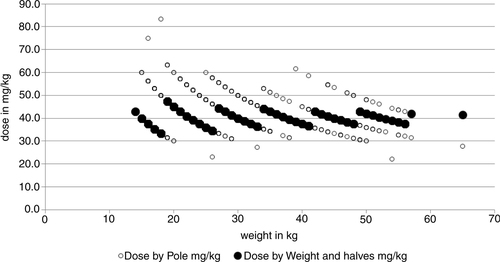
Fig. 6 Histograms of doses given by the dose-pole for each dose given by the weight and halves approach.
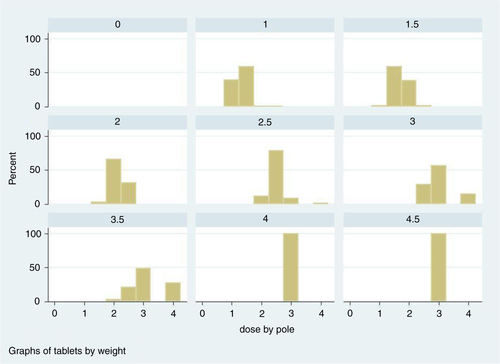
Fig. 7 Theoretical distribution of doses (mg/kg) in the case of an accurate scale and when the scale overestimates the weight by 2 kg.
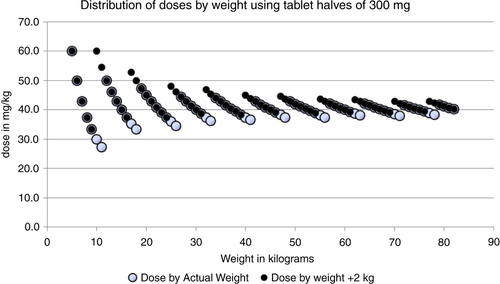
Table 5 Theoretically determined doses according to weight using tablet halves as the standard minimum dose fraction based on the weight of the child and with a dose never below 40 mg/kg
Table 6 Theoretically determined doses based on the weight of the child using tablet halves as the standard minimum tablet fraction and resulting in doses that are never below 40 mg/kg