
Figures & data
Table 1 Participant characteristics at enrolment by site
Table 2 Distribution of HAART status, employment, smoking, and TB by site
Fig. 1 Survival and mortality rate plots by site. a) displays the cumulative probability of death by site in the cohort of HIV-infected people in South Africa. b) is a plot of mortality rates during follow-up by site showing the period prior to initiating HAART to post-HAART.
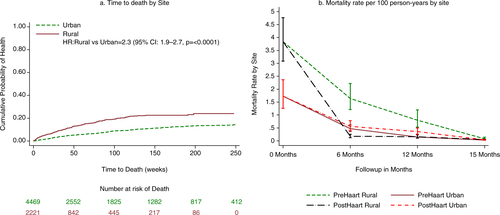
Table 3 Characteristics of those who died
Table 4 Factors associated with mortality in rural and urban South Africa