Figures & data
Table 1 Facility survey mapped to WHO building blocks
Table 2 Change in domain scores from baseline to 12 months among intervention facilities compared to prior supported facilities
Fig. 1 Per capita HS investments* in 2011 USD by funding source among intervention facilities (N=14) over a 12-month period to reference facilities (N=6) at baseline. *Includes in-kind donations.
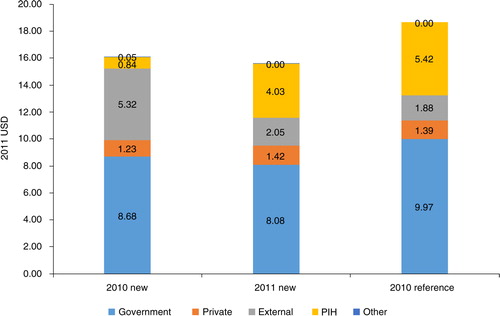
Fig. 2 Sustainability in Facility Readiness Improvement among Intervention Facilities (N=14) after 36 months.
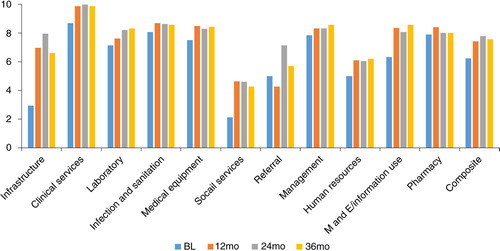
Table 3 Correlation between difference in composite facility score over 12 months and other covariates among 14 intervention facilities
Fig. 3 Correlation between change in composite facility score and change in direct PHIT HSS funding among intervention facilities (N=14). Number in cells is the rank based on baseline composite score (lowest to highest).
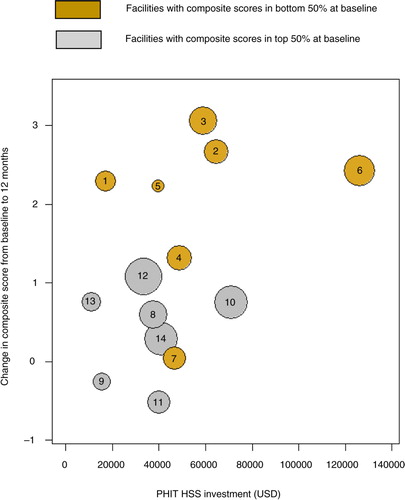
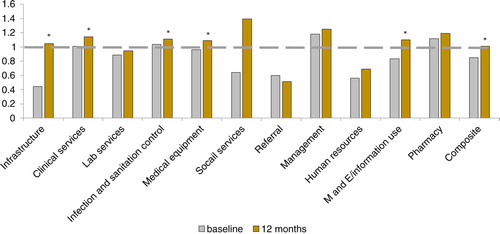
Fig. 4 Standardized comparisons of intervention facilities (N=14) at baseline and 12 months to baseline facility scores for reference facilities.