Figures & data
Table 1 Summary description of variables
Table 2 Decomposition of health inequality, South Africa, 2012/13
Fig. 1 The contribution of social determinants of health to health inequality in South Africa, 2012/13. The error bars represent 95% confidence intervals based on bootstrapped standard errors using 1,000 replications.
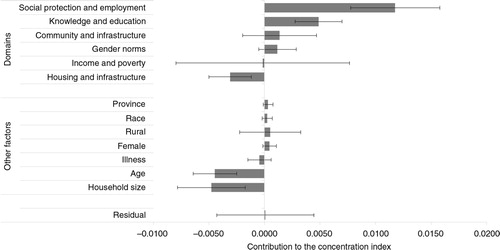
Table 3 Percentage contribution of the ‘domains’ to health inequality in South Africa, 2012/13
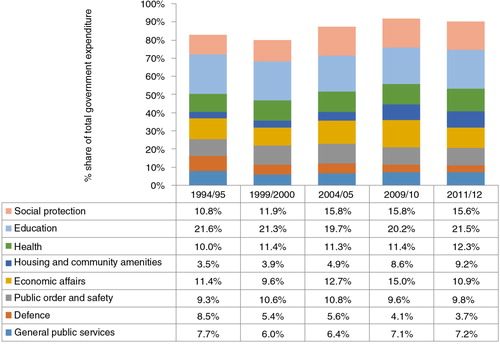
Fig. 2 Selected public expenditure categories as a share of total public expenditure, South Africa 1994–2012. From ref. (Citation51).