Figures & data
Fig. 1 Changes in the cumulative weekly dengue incidence (per 100,000 population) and median of weekly dengue incidences (per 100,000 population) during the course of the year, for 2003–2012. x-Axis: weeks; primary y-axis: cumulative weekly dengue incidence; secondary y-axis: median of weekly dengue incidences.
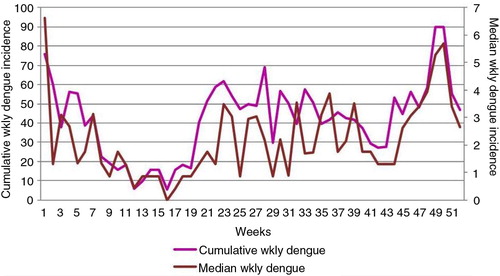
Fig. 2 Changes in weekly minimum (T min), maximum (T max), and mean (T mean) temperatures and cumulative weekly dengue incidence over the course of all 52 weeks of the year, for 2003–2012. x-Axis: weeks; primary y-axis: temperature in degrees Celsius; secondary y-axis: cumulative weekly dengue incidence.
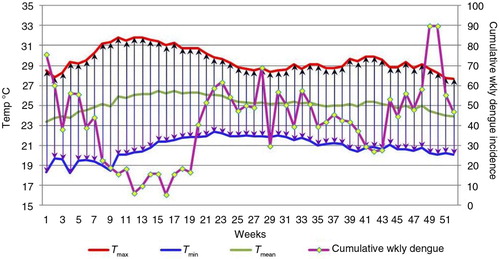
Fig. 3 Changes in weekly diurnal temperature range (DTR) in °C (red) and cumulative weekly dengue incidence (purple) over the course of all 52 weeks of the year, 2002–2012. x-Axis: weeks; primary y-axis: DTR in degrees Celsius; secondary y-axis: cumulative weekly dengue incidence.
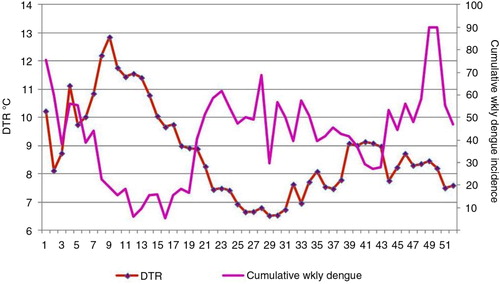
Fig. 4 Changes in weekly night-time humidity, daytime humidity, and cumulative weekly dengue incidence over the course of all 52 weeks of the year for the period 2003–2012. x-Axis: weeks; primary y-axis: relative humidity (%); secondary y-axis: cumulative weekly dengue incidence.
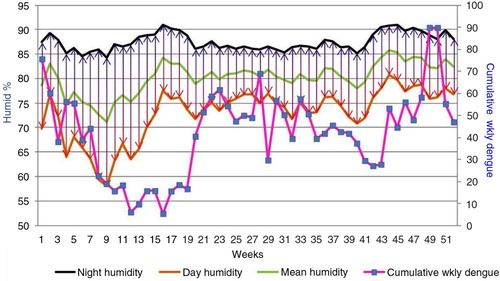
Fig. 5 Changes in weekly diurnal humidity range % (DHR) and cumulative weekly dengue incidence over the course of all 52 weeks of the year, 2003–2012. x-Axis: weeks; primary y-axis: DHR in percent; secondary y-axis: cumulative weekly dengue incidence.
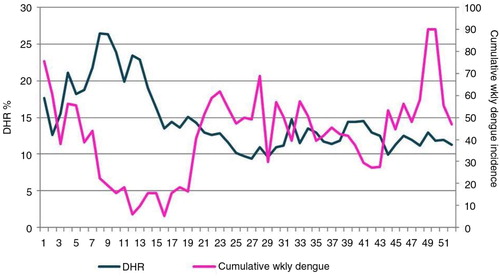
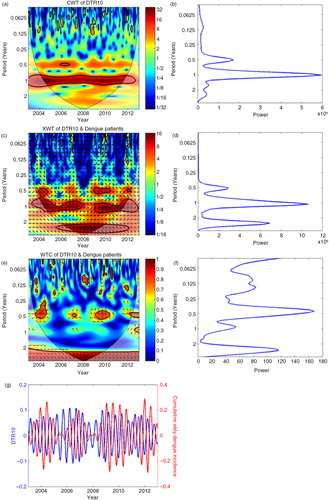
Fig. 6 Results of the wavelet analysis of weekly dengue incidence versus number of days per week with DTR >10°C as a sample of wavelet analysis results. (a) Continuous wavelet transform (CWT) variations; (b) wavelet power of CWT; (c) cross wavelet transform (XWT) variations; (d) wavelet power of XWT; (e) wavelet coherence (WTC); (f) wavelet power of WTC; (g) reconstructed time series for selected periods. In Fig. a, c, and e, there are colour-coded columns on the right side of the main figure. Those indicate the strength of coherence in which dark blue and dark red indicate the lowest and highest coherence, respectively. Areas inside the thin parabolic black line (cone of influence) are not influenced by the edges of data. Term period in the vertical axis indicates duration of cycle (in years).