
Figures & data
Fig. 1 Geographic distribution of AFB microscopy services and areas within 10 km distance from the nearest TB diagnostic (AFB microscopy) facilities in the Sidama Zone, in 2003, 2010 and 2012.
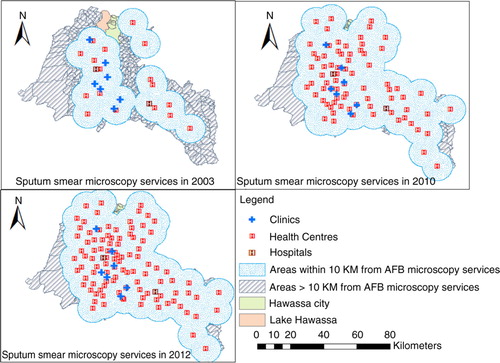
Fig. 2 Geographic distribution of DOTs services and areas within 10 km distance from the nearest TB treatment facilities in the Sidama Zone in 2003, 2010 and 2012.
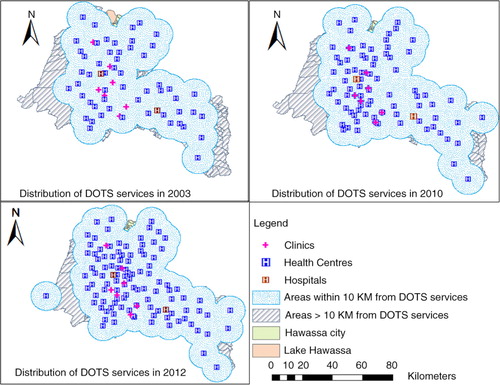
Table 1 Characteristics of smear-positive pulmonary tuberculosis cases during the active case-finding intervention (2011–2012) and prior period (2003–2010) in the Sidama Zone, southern Ethiopia
Fig. 3 Distribution of distance from the nearest AFB facility (sputum microscopy service) and smear positive PTB case notification rates in the Sidama Zone, 2003 and 2012.
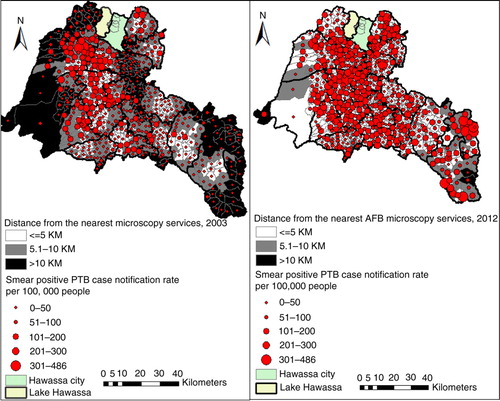
Fig. 4 Areas within different distances from AFB (sputum smear microscopy) services and mean case notification rates of smear-positive PTB in the Sidama Zone, 2003–2012.
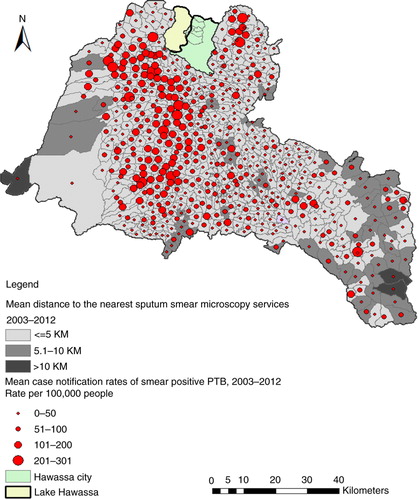
Table 2 Multiple linear regression model of kebele level estimates for the relationship between the case notification rates of TB and accessibility, altitude, and population density in the Sidama Zone in southern Ethiopia, 2003–2012
Table 3 Multiple linear regression model for the relationship between proportion of patients with treatment success (completed or cured) and accessibility, altitude, and population density in the Sidama Zone in southern Ethiopia, 2003–2012