Figures & data
Table 1 Selected current population and economic characteristics of Burkina Faso, Ethiopia, and Nigeria
Fig. 1 Percentage of demand for family planning met with modern contraceptive methods and modern contraceptive prevalence rates in 194 countries in 2014. Large grey circles represent the unweighted average of countries by development classification by United Nations: least, less, and more developed countries (n=49, 103, and 42, respectively).
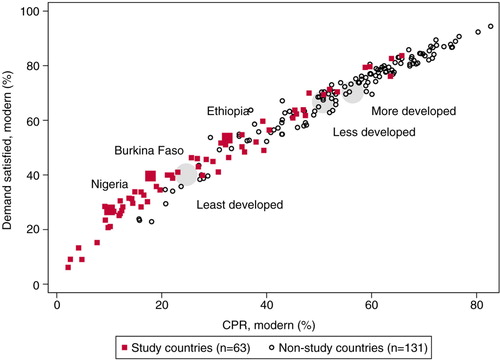
Table 2 Percentage demand for family planning met with modern methods (2014 and 2030), annual rates of change (2014–2030), and the number of women using modern methods according to current projection and benchmark scenarios among 63 selected countries
Fig. 2 Demand for family planning and modern contraceptive prevalence rates in Burkina Faso, Ethiopia, and Nigeria: current estimates and projections versus progress needed to meet the benchmark of 75% by 2030. MCPR, modern contraceptive prevalence rate.
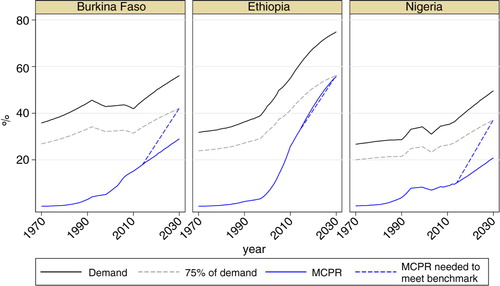
Table 3 Percentage of demand for family planning met with modern methods (2014 and 2030), annual rates of change (2014–2030), and the number of women using modern methods according to current projection and benchmark scenarios in Burkina Faso, Ethiopia, and Nigeria
Fig. 3 Scatter plot of annual rate of changes in demand for family planning satisfied with modern methods by initial level: eight 5-year periods between 1970 and 2010 from 194 countries. Solid curved line is a quadratic fitted line (R 2 0.17). A total of 1,552 observations are specific to a 5-year period and a country. The annual percentage point changes range from −3.87 (Timor-Leste 1995–2000) to 7.81 (Rwanda 2005–2010). Only 1,520 observations between the 1st and 99th percentile of the changes are shown, ranging from −0.78 to 3.50.
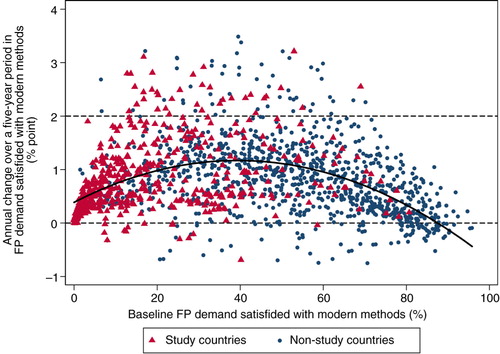
Table 4 List of countries and periods during which the annual change in family planning demand satisfied with modern methods exceeded two percentage points
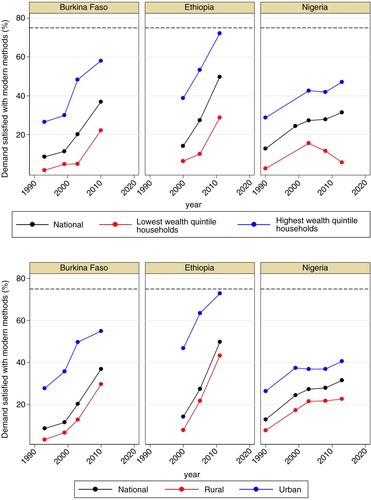
Fig. 4 Trends in demand satisfied with modern methods by household wealth and residential area: Burkina Faso, Ethiopia, and Nigeria, by socio-economic and rural–urban status. Source: Demographic and Health Surveys through STATcompiler.com.