
Figures & data
Fig. 1 Indicators and cluster domains according to the EQuAL framework. Source: Elaboration from (unpublished result).
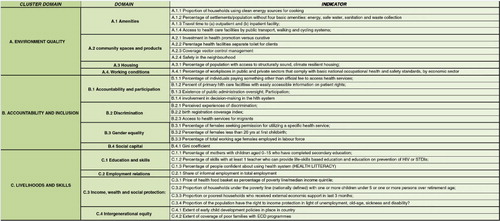
Table 1 Indicators according to income quintiles (first the poorest, fifth the richest), rate differences, rate ratios and concentration index
Table 2 Indicators according to urbanization
Fig. 2 Geographical patterns of poverty rate, illiteracy rate, and life expectancy in the year 2010 in Brazil. Source: Elaboration from the Brazilian Institute of Geography and Statistics (IBGE).
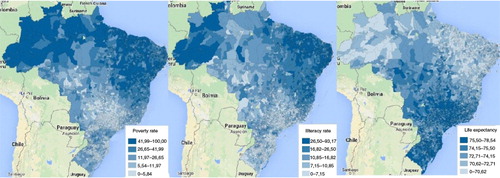
Table 3 Indicators according to Brazilian administrative region
Table 4 Indicators according to race
Table 5 Double stratification of indicators according to income quintiles (first the poorest, fifth the richest) and urbanization