
Figures & data
Fig. 1 Activity diagram for the identification process. The solid circle at the top of the flow diagram indicates the start of the process. The colored rectangles with curved edges indicate the major steps in the activity. The diamond shapes in the flow diagram represent points of decision in the activity; the arrows show the sequence and directions of the activity. The plain (white) rectangles provide more explanation for some of the processes. These plain rectangles are linked to the processes they explain by dotted lines; the solid circle with a white ring around it indicates the end of the activity.
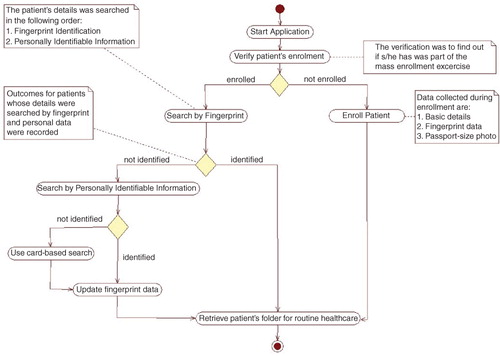
Fig. 2 Computer hardware and logistics: (1) the raincoats; (2) the mouse; (3) the biometric fingerprint devices; (4) the web cameras; (5) the mini-laptops; (6) the red calico used for the background of the photos taken; (7) the spare batteries for the mini-laptops; and (8) the field notebooks used.
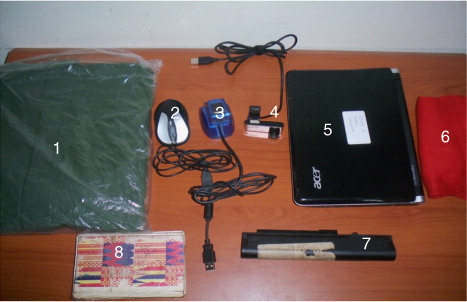
Fig. 3 Setup for the computers, with peripheral devices. This setup is typical of computers at the health facilities. Each of the peripheral devices was connected to the computer system's unit via a USB cable. The device to the extreme right of the diagram is the fingerprint detector. Next to the fingerprint detector is a barcode reader for scanning identification cards with barcodes. The last device (black) is a web camera.
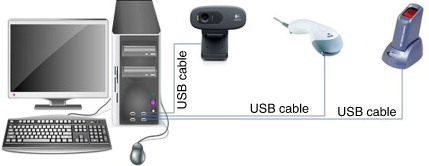
Fig. 4 Age grouping for visits successfully identified by fingerprint for the year 2012. The x-axis categorizes the number of successful identifications by month. The values on the y-axis are percentage rates over the total number of visits searched by fingerprints for the given month. The bar graphs indicate the percentage of patient visits from three age groupings for which fingerprint identification was successful. The blue bar graphs represent age groupings from 13 years and above, the red bars represent age groupings from 2 years to 12 years, and the green bars represent age groupings of children under 2 years.
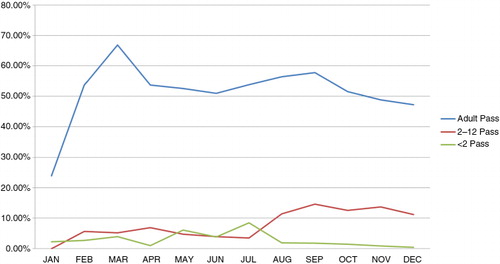
Table 1 The confusion matrix of the fingerprint, and other identification tests
Table 2 Sensitivity and specificity of fingerprint and other identification test