
Figures & data
Fig. 1 Mapping of effects of interventions and threats on epidemiological parameters in the Thembisa model. Dashed lines represent effects that are less direct or less well-established. *Corresponds to multiple parameters in . ANC = antenatal care, ART = antiretroviral treatment, EBF = exclusive breastfeeding, EID = early infant diagnosis, HCT = HIV counselling and testing, POC = point of care, PrEP = pre-exposure prophylaxis, sc ARVs = short-course ARVs, SWs = sex workers.
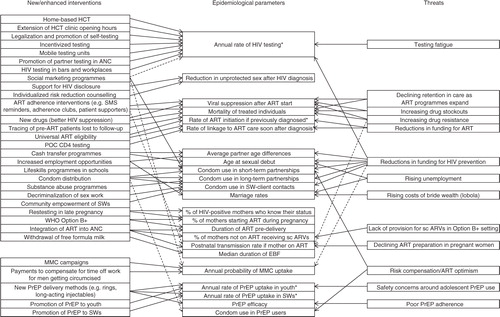
Table 1 Parameters included in uncertainty analysis
Fig. 2 South African HIV incidence trends and progress towards the 90-90-90 targets. Solid lines represent averages from 1,000 simulations; dashed lines represent 95% confidence intervals (2.5 and 97.5 percentiles of distribution of model outputs). Shaded areas represent virtual elimination targets (panels a, b) and 90-90-90 targets (panels c through f). *Denominator is the number of births to HIV-positive mothers plus the number of mothers who seroconvert while breastfeeding, and numerator includes all cases of perinatal and postnatal transmission. ART = antiretroviral treatment. VL=viral load.
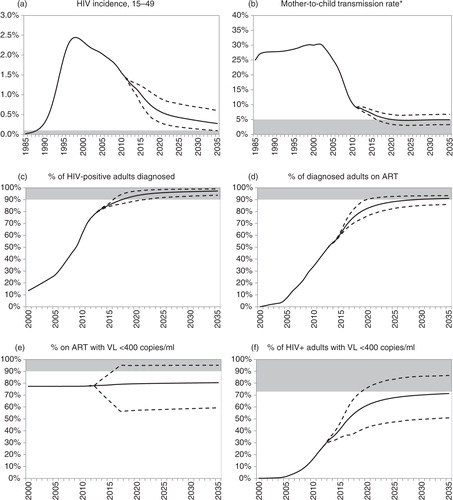
Fig. 3 Correlation coefficients between epidemiological parameters and HIV incidence measures over the 2015–2035 period. Zero represents no association, and the interval between the dashed lines represents correlation coefficients that are not significantly different from zero. A positive value represents a positive association between the parameter of interest and future HIV incidence. ART = antiretroviral treatment, BF = breastfeeding, EBF = exclusive breastfeeding, HBCT = home-based counselling and testing, HCT = HIV counselling and testing, MMC = medical male circumcision, POC = point of care, PrEP = pre-exposure prophylaxis, RR = relative rate.
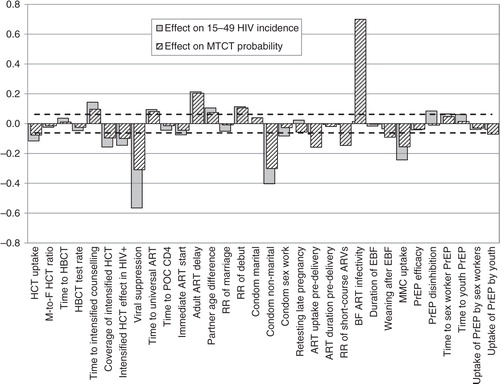
Table 2 Multivariate analysis of epidemiological parameters affecting HIV incidence in 15–49-year-olds (2015–2035)