Figures & data
A map of Hanoi, Vietnam
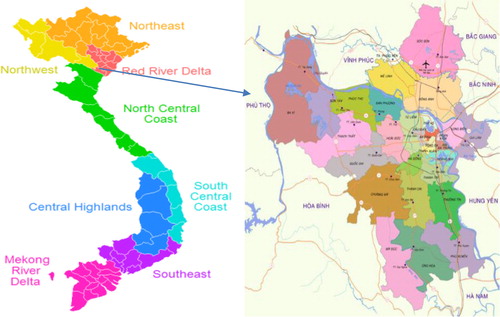
Fig. 1 The average of monthly mean temperature and maximum temperature during the 5-year period 2008–2012. Max. temperature (°C): Mean =28, SD=± 6.3, Min=8 and Max=40.4; Mean temperature (°C): Mean=24.3, SD=± 5.6, Min =7.4 and Max=34.5.
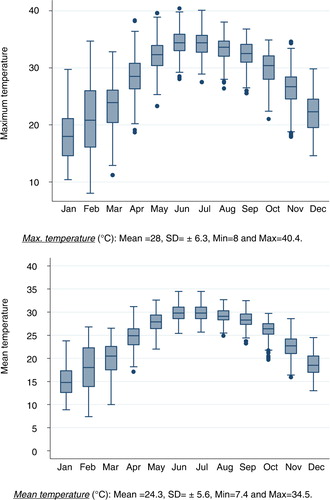
Fig. 2 The number of cases for specific mental disorders during 5 years 2008–2012. F0–9: Organic, including symptomatic, mental disorders; F10–19: Mental and behavioural disorders due to psychoactive substance use; F20–29: Schizophrenia, schizotypal, and delusional disorders; F30–39: Mood (affective) disorders; F40–48: Neurotic, stress-related, and somatoform disorders; F50–59: Behavioural syndromes associated with physiological disturbances and physical factors; F70–79: Mental retardation; F99: Unspecified mental disorder.
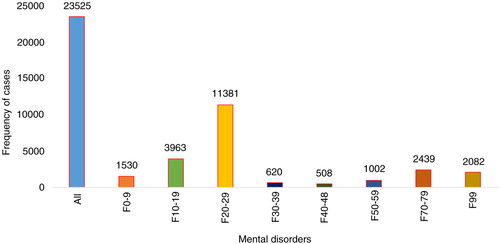
Fig. 3 The characteristics of study population.
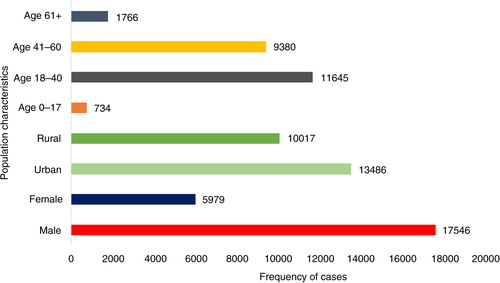
Fig. 4 The relationship between daily hospital admissions for mental disorders and seasonality. F0–9: Organic, including symptomatic, mental disorders; F10–19: Mental and behavioural disorders due to psychoactive substance use; F20–29: Schizophrenia, schizotypal, and delusional disorders; F30–39: Mood (affective) disorders; F40–48: Neurotic, stress-related, and somatoform disorders; F50–59: Behavioural syndromes associated with physiological disturbances and physical factors; F70–79: Mental retardation; F99: Unspecified mental disorder.
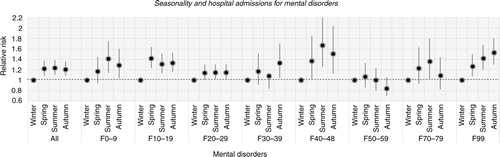
Fig. 5 The relation between daily hospital admissions for mental disorders and monthly trends.
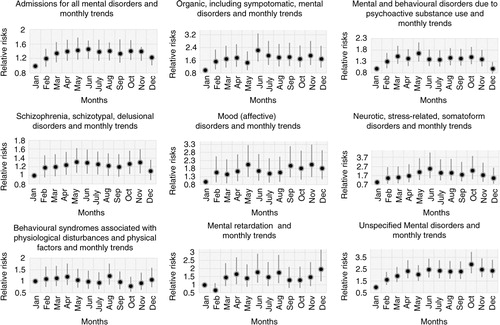
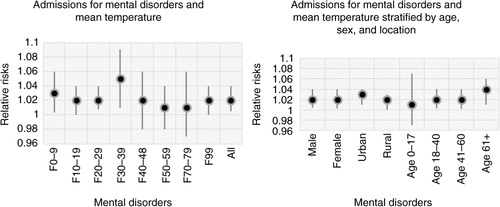
Fig. 6 The association between daily hospital admissions for mental disorders and seasonality stratified by sex, location, and age.
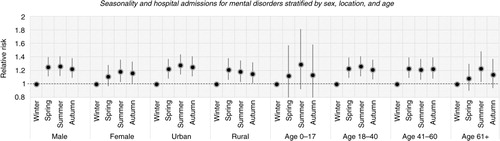
Fig. 7 The associations between daily hospital admissions for mental disorders stratified by sex, location and age groups.
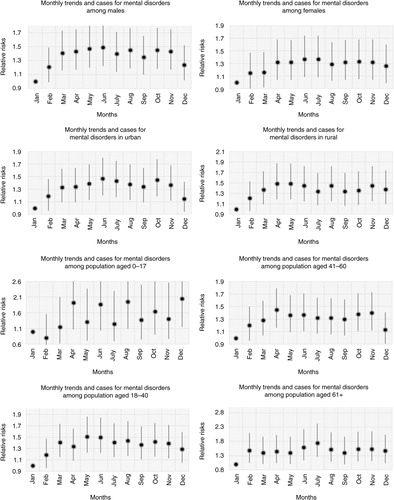
Table 1 The relationship between temperatures and daily hospital admissions for mental disorders during 5 years (2008–2012)
Fig. 8 The relationship between daily hospital admissions for mental disorders and the variation in ambient mean temperature.