Figures & data
Fig. 1. Total number of reported Swedish DF cases and areas of infection during the time period 1995–2010.
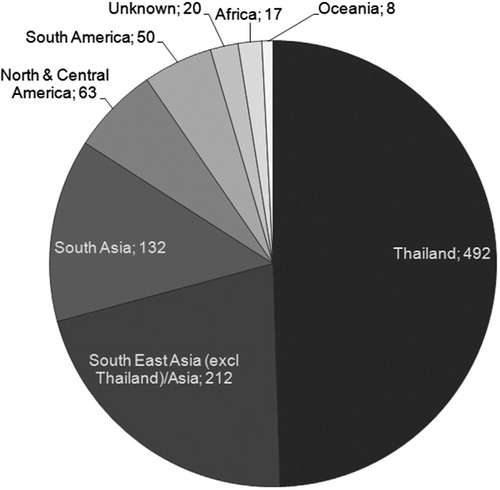
Fig. 2. Incidence of diagnosed DF cases per 100,000 travels in Swedish travelers returning from Thailand during 2000–2009.
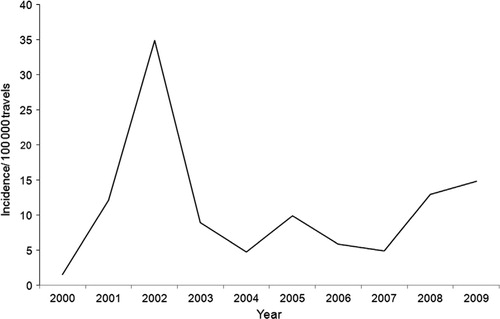
Fig. 3. Incidence of diagnosed DF cases per 100,000 travels in Swedish travelers returning from Thailand in 2000–2009 (black line) and the estimated number of travels to Thailand during the same time period (gray line).
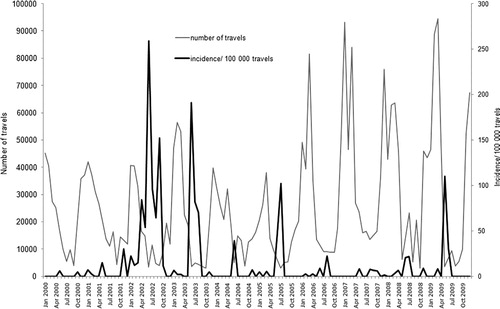
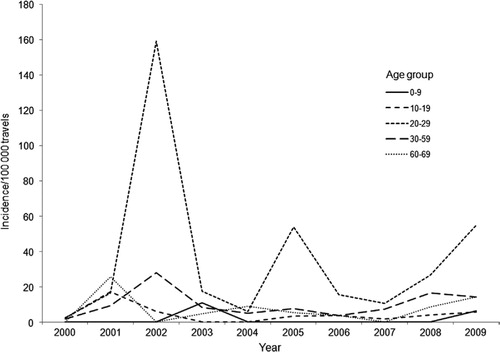
Fig. 4. Incidence of diagnosed DF cases per 100,000 travels in Swedish travelers returning from Thailand in different age groups during 2000–2009.