Figures & data
Fig. 1. Sampling arrangement in a sewage line at Kalmar county hospital. The sampling equipment was installed in a manhole. Wastewater was pumped from a sump placed with the bottom lower than the main furrow in the manhole to ensure the continuous presence of water in the sump. In the tank, settled particles were collected in tubes
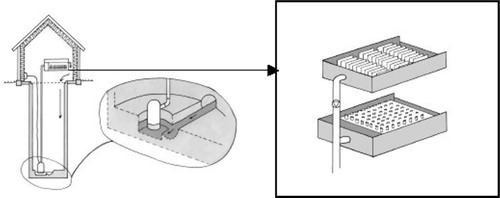
Table 1. Breakpoints for sensitive (S), intermediate (I) and resistant (R) categorisation by the paper disc method and minimum inhibitory concentration (MIC) breakpoints for resistance categorisation by the spread plate method
Table 2. Resistant coliform bacterial isolates (/total isolates) by the disc diffusion method on PDM agar and percentage resistant coliform bacteria as determined by the ratio CFU ml−1 on LES endoagar with and without antimicrobials (%) in concentrations corresponding to
Table 3. Resistant intestinal enterococci isolates (/total isolates) by the disc diffusion method on PDM agar and percentage resistant enterococci as determined by the ratio CFU ml−1 on ES agar with and without antimicrobials (%) in concentrations corresponding to
Fig. 2. Dendrogram from PhP-typing of ciprofloxacin-resistant faecal enterococci at sample dates
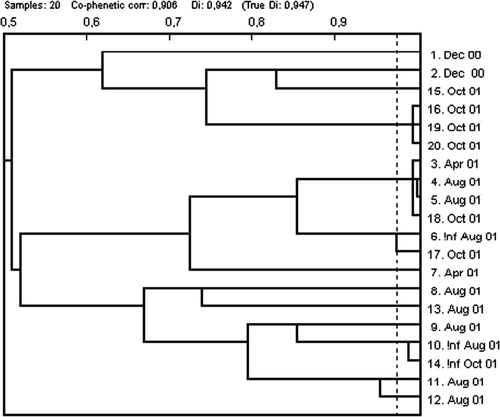
Table 4. Generation and lag-phase times (±standard deviation) (min) for nine independent intestinal enterococci isolates from three CIP resistance classes in different ciprofloxacin concentrations (µg l−1)