Figures & data
Fig. 1 Incidence (×100,000 population) of Q fever laboratory tests (n =11,035) with locations of all small ruminant farms with ≥50 animals in the south of the Netherlands by four-digit postal code area. Data from patients testing positive in 2009 and 2010, and patients testing negative in 2010 at the laboratories in 's-Hertogenbosch (H) and Veldhoven (V).
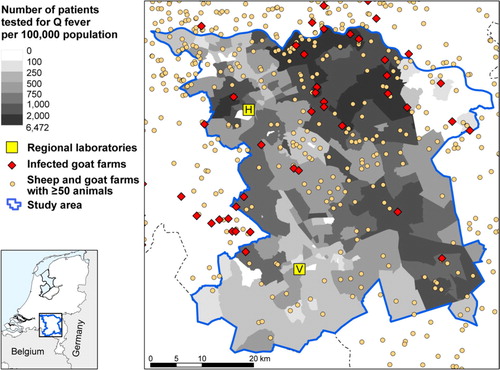
Fig. 2 Proportion of positive test results based on the same data as in with locations of infected goat farms.
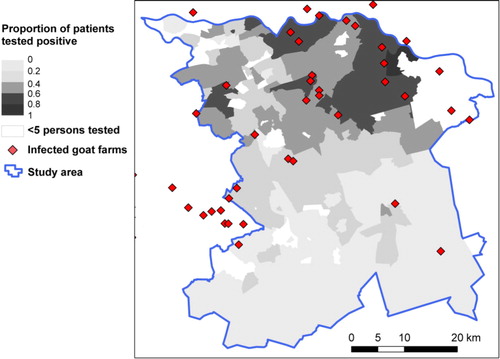
Table 1 Characteristics of individuals with a positive or negative laboratory test result
Table 2 Multivariate logistic regression analysis of risk factors associated with testing positive for Q fever
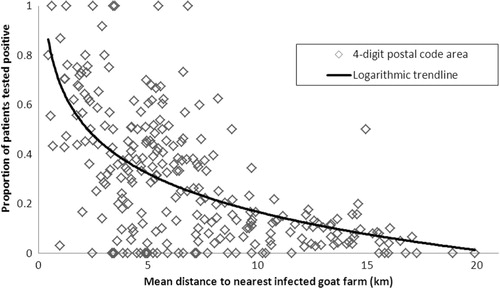
Fig. 3 Proportion of patients testing positive for Q fever against mean distance from nearest infected dairy goat farm, per four-digit postal code area (n=262 postal codes areas).