
Figures & data
Fig. 1. The NE incidence in Sweden in the study period (June 2011–July 2012).
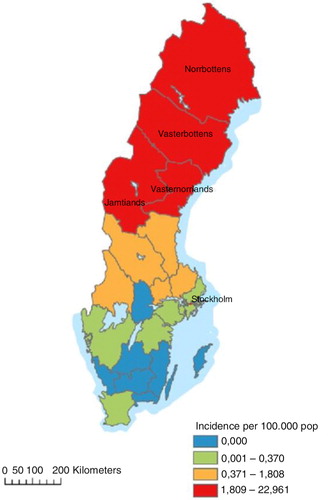
Fig. 2. Age and sex distribution of cases and controls, NE study, Sweden 2011–2012.
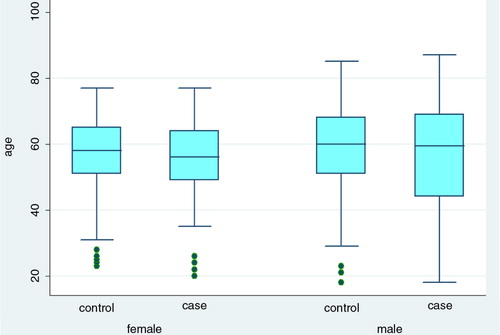
Table 1 Distribution of cases and controls by reporting county, NE study, Sweden 2011–2012
Table 2 Matched odds-ratios (mOR) with 95% confidence intervals (95% CIs) and p value through conditional logistic regression for various exposures, Sweden 2011–2012
Table 3 Descriptive data on potential preventive measures, NE case–control study, Sweden 2011–2012
Table 4 Adjusted mOR with 95% confidence intervals (CIs) and p values, Sweden 2011–2012