
Figures & data
Fig. 1. Study flow chart of the screening and randomisation process, treatment, and follow-up for the participants in the study.
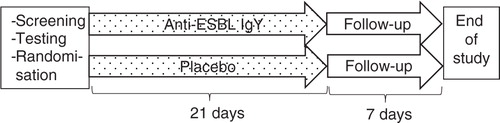
Fig. 2. Flow chart of the number of participants who did not complete the study until randomisation. LFU: lost to follow-up; SC: failure to meet with the study criteria; HTTP: high threshold to participate.
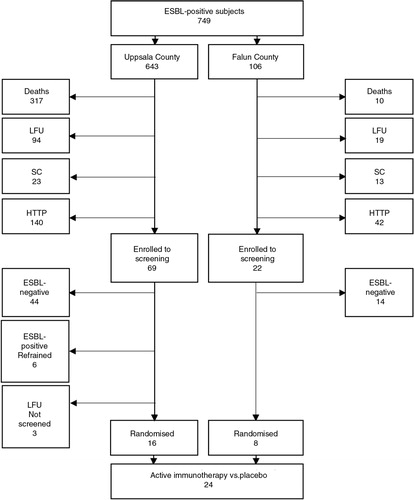
Table 1 ESBL carriage: age, sex, strains, and the time interval between samples from the first and second positive test at the screening test of the enrolment group