
Figures & data
Fig. 1 Map of Wild boar sampling (left) and TBEV-seropositives (right) in Flanders. Left Part: Study population and positives per community; Right Part: Calculated wild boar TBEV-seroprevalence based on 10 SNT-reactors (positive/borderline – cut-off 1/10) out of 238 wild boar tested. FLA: Flanders total study population (n=238); WFL: West Flanders subpopulation (n=77); LIM: Limburg+Antwerp subpopulation (n=161).
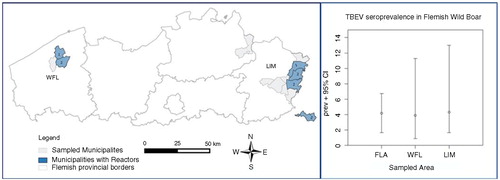
Table 1 Confirmation panel of 10 TBEV-reactors in SNT and/or ELISA.