Figures & data
Fig. 1 Simplified graphic illustration of the network model concept. The blue boxes represent households, the green box represents day care centre, whereas the yellow box represents school. Individuals within the same household have contact with each other, whereas individuals within the same day care centre or school have contact with each other only if they belong to the same group or class, respectively. Disease transmission can only occur via edges, i.e., contacts between vertices, i.e., individuals. The edges are bidirectional, that is, disease may be transmitted in both directions. Adapted from Karlsson et al. (Citation20).
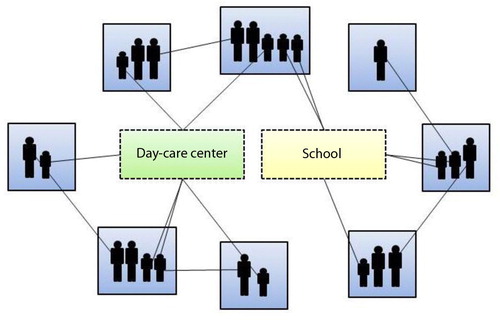
Fig. 2 Model flowchart. The age-structured population and the contact structure were held constant between and during simulations. All simulations were initiated with equivalent sets of pneumococcal carriers, and all parameters, except for volume of outpatient penicillin consumption and transmission probabilities reflecting fitness costs, were held constant for each scenario. PSP=penicillin-susceptible pneumococci.
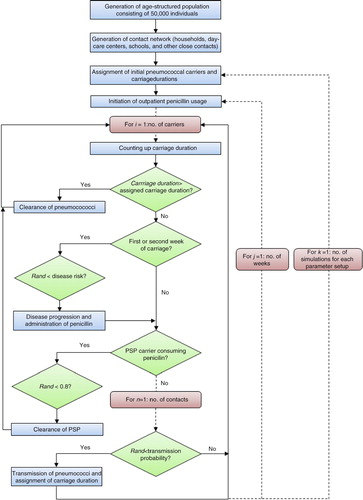
Table 1 Baselines values for the model parameters
Table 2 Outpatient penicillin (PcV) sales in Sweden 2010 (Citation44)
Fig. 3 Outcomes for scenarios simulated using varying fitness cost for the PNSP clone. For each scenario, 100 simulations were performed and the outcomes were averaged to find the most probable outcome. The implemented fitness costs for the PNSP clone ranged between 0 and 10%. (a) Relative frequency of average number of transmissions for the penicillin-susceptible pneumococci clone and the PNSP clone. (b) Plot of average number of transmissions for the PNSP clone against fitness cost with fitted regression line (F 1,9=311, p<0.001; average number of transmissions=17,843 – 1,326×fitness cost (%), r 2=0.97). Error bars indicate 95% confidence interval. PNSP, penicillin non-susceptible pneumococci.
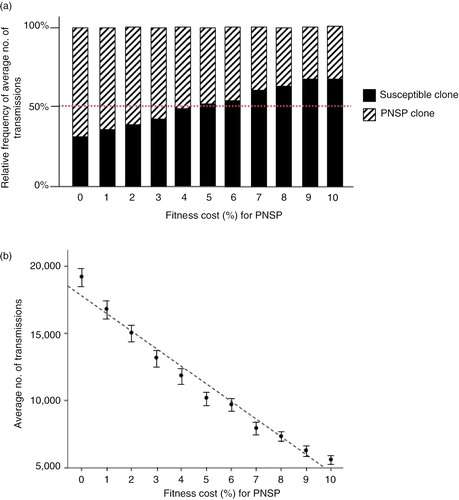
Fig. 4 Average number of transmissions for susceptible clone and PNSP clone by implementing reduced outpatient penicillin consumption. The fitness cost for the PNSP clone was fixed at 5% and the default penicillin consumption was set according Sweden year 2010 (Citation44). Error bars indicate 95% confidence interval. PNSP, penicillin non-susceptible pneumococci.
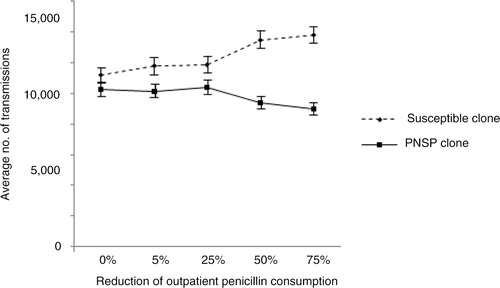
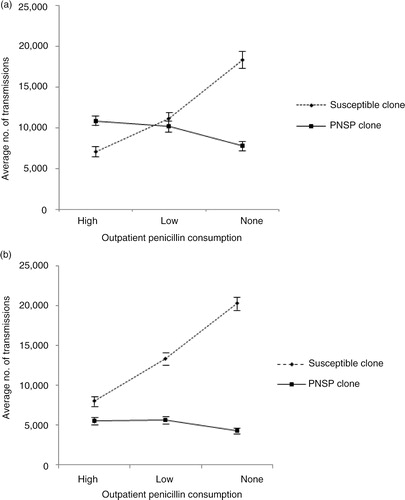
Fig. 5 Average number of transmissions for susceptible clone and PNSP clone by implementing varying degrees of penicillin consumption. (a) 5% fitness cost for the PNSP relative to the susceptible clone. One-way ANOVA ( F 2,297=27.9, p<0.001) followed by post hoc Tukey test revealed significant differences in the number of transmissions for the PNSP clone between low and no penicillin consumption (p<0.001) as well as between high and no penicillin consumption (p<0.001). (b) 10% fitness cost for the PNSP relative to the susceptible clone. One-way ANOVA (F 2,297=14.4, p<0.001) followed by post hoc Tukey test revealed significant differences in the number of transmissions for the PNSP clone between low and no penicillin consumption (p<0.001), as well as between high and no penicillin consumption (p<0.001). Error bars indicate 95% confidence interval. PNSP, penicillin non-susceptible pneumococci.