Figures & data
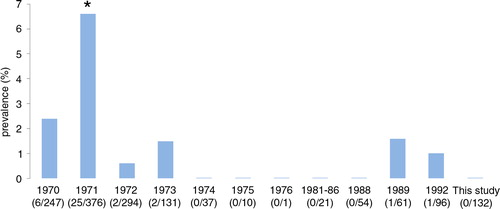
Fig. 1 Geographical origin of captured wild rats. Dots indicate number of rats that were captured. Triangles indicate farms where brown (brown triangle) and black rats (black triangle) were captured.
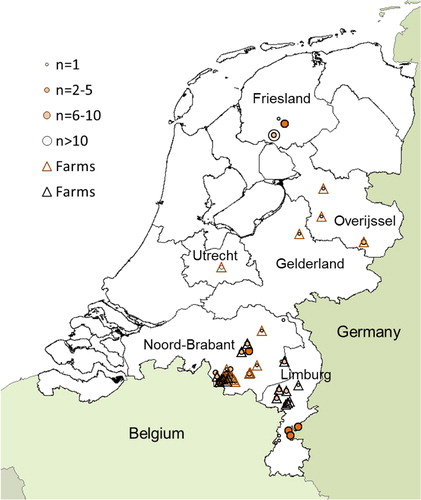
Table 1 Geographical, temporal, and biological data of captured rats
Fig. 2 Distribution of rat species from the southern provinces per season (a) and per year (b). The width of the blocks is proportional to the number of rats per factor indicated underneath. The percentage of rat species is indicated at right vertical axis.
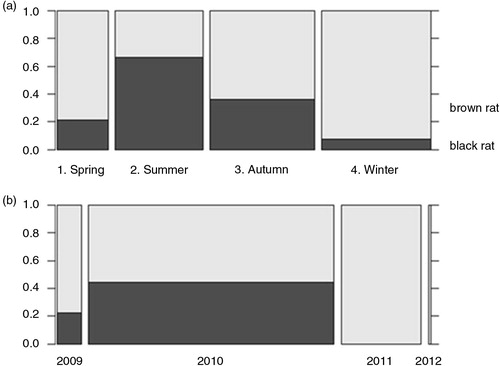
Fig. 3 Plagiorchis muris (a), Plagiorchis proximus (b) and Notocotylus imbricatus (c) isolated from wild rats. Unstained trematodes (a and b ventral view, c dorsal view) as seen with enhanced contrast microscopy. cs cirrus sac, gp genital pore, o ovarium, os oral sucker, p pharynx, t testis, u uterus, vs ventral sucker, v vitellaria.
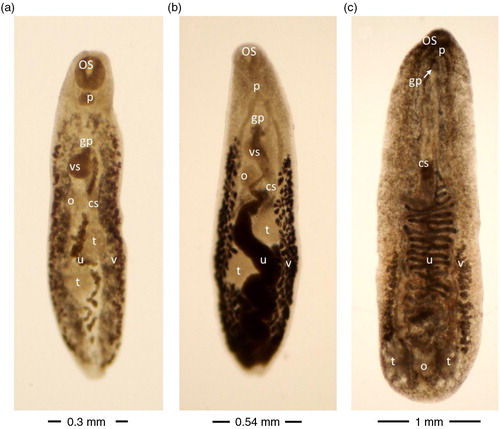
Table 2 Prevalence of helminth species in rats, differentiated by location type and host (brown rat and black rat)
Table 3 Prevalence of helminth species captured in the province of Brabant, differentiated to location type and host (brown rat and black rat)
Table 4 Prevalence of helminth species captured in the province of Limburg, differentiated to location type and host (brown rat and black rat)
Fig. 4 Helminth profile per six-digit postal code area (anonymised) from the provinces of Brabant and Limburg, where both brown and black rats were captured. Forty-three six-digit postal code areas were sampled and arranged top-down in increasing order. ‘P’ represents province where rats were captured: grey for Brabant and dark grey for Limburg. ‘R’ represents rat species: black for black rats, brown for brown rats. Helminth species numbers in the second row correspond with species given in Table II. Neighbouring postal code areas are indicated by vertical purple bars at the right.
Each row represents a single postal code and row height indicates the number of rats captured. Helminth prevalence is depicted as histogram per postal code area and bar height corresponds to number of helminth positive rats; lowest rows represent one rat.
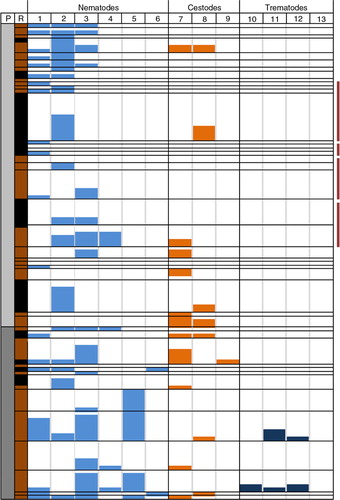
Table 5 Numbers of captured rats per season, stratified for location type and year
Fig. 5 The number of simultaneous helminth species correlates with cumulative helminth abundance. (a) The numbers of helminth species predicted by the generalised linear model (Predicted rate) correlate with observed number of helminth species (p(Chi)2=0.9678). Note that the model predicts fractions, whereas helminths are counted in discrete numbers. Data points are presented jittered, to minimise overlap. (b) Simultaneous helminth infections correlated positively with cumulative abundance. The dots show observed data; the line shows model fit to the data, which differs between provinces. Note that in the province of Limburg, data are segregated by location type. Since the model compares √(cumulative abundance) with log transformed number of helminths, count value 0 is placed below the horizontal axis.
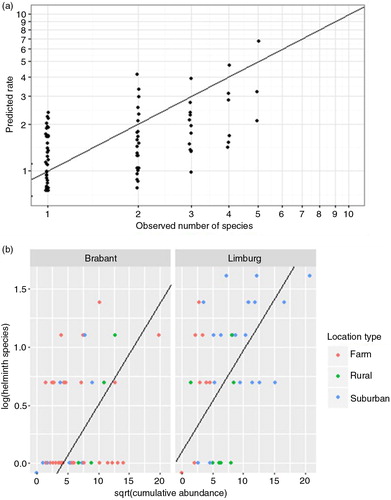
Fig. 6 Historic Trichinella prevalence in wild rats in The Netherlands during the period 1970–1992 (adapted from (Citation6) and (Citation7)) and results from this study. The observed prevalence did not differ significantly from year to year, except for the year 1971 (Fisher's exact test). *Indicates significance.