
Figures & data
Fig. 1 Map over southern Sweden showing the geographic location of the herds from which isolates were analysed. Green=Västergötland, Yellow=Östergötland, Red=Skåne, Blue=Endemic region (Öland).
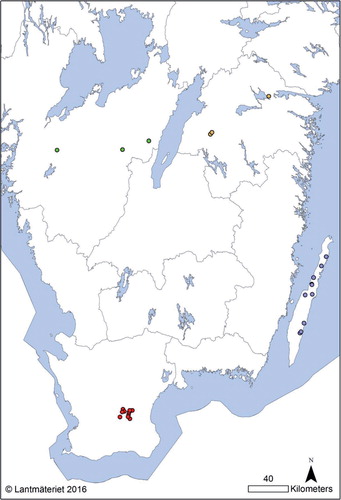
Table 1 Salmonella Dublin isolates selected for WGS
Fig. 2 Maximum likelihood tree based on SNP variation among the 28 S. Dublin isolates included in the study. Ten herds were located in the one endemic region in Sweden, Öland (purple), three herds in Östergötland (yellow), ten herds in Skåne (red), and three herds in Västergötland (green). From two of the herds in Skåne, there were two isolates from samplings performed 1 year apart, Osk-1, Osk-2 and Nsk-1, Nsk-2. Distance to the reference sequence is not shown to scale as indicated by broken lines. Percent bootstrap support for branches is shown as grey numbers, only shown for >85%. Minimum pair-wise SNP distances between the clusters are shown to the left of the tree, and the range of pair-wise within cluster distances for each cluster is shown on the right side (Aös was excluded from these calculations). Known contacts from epidemiological investigations are described in the right part of the figure. Isolates from herds with known epidemiological contacts were generally closely related.
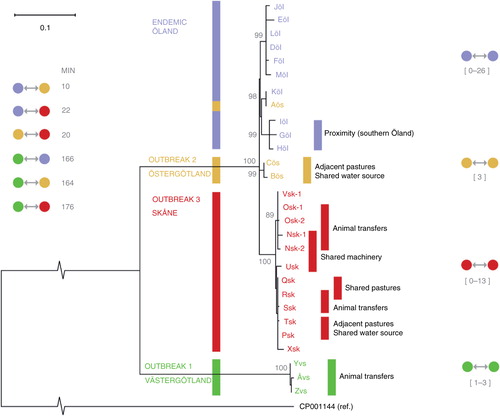
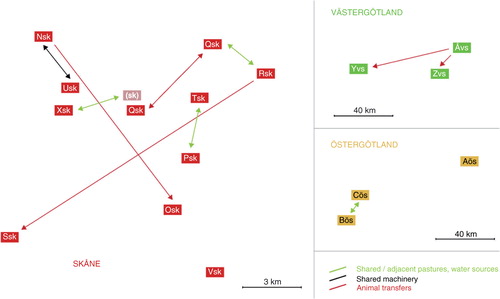
Fig. 3 Known contacts between herds from which isolates were analysed. Distances in this figure are proportional to the real distance between the herds. The contacts were revealed during the epidemiological investigations in the three outbreak regions. From one of the included herds (sk), there was no isolate available; however, animals from Xsk had been grazing at a pasture on this farm that was located adjacent to Qsk. There were no known contacts between the herds in the endemic region (Öland).