Figures & data
Table I DNA cluster frequencies
Fig. 1 Dendrogram of clustering analysis of the IS6110 RFLP patterns of the strains in this study. Dendrogram nodes and associated sub-branches that fit the cluster definition (≥85% pattern similarity) are highlighted in bold. The NWT clusters are represented as follows: • NWT1; *NWT2; ♦ NWT3; [odot] NWT4; ▪ NWT5; ▴ NWT6; NWT7; NWT8.
![Fig. 1 Dendrogram of clustering analysis of the IS6110 RFLP patterns of the strains in this study. Dendrogram nodes and associated sub-branches that fit the cluster definition (≥85% pattern similarity) are highlighted in bold. The NWT clusters are represented as follows: • NWT1; *NWT2; ♦ NWT3; [odot] NWT4; ▪ NWT5; ▴ NWT6; NWT7; NWT8.](/cms/asset/9a8f71a2-eca3-465d-b0d2-869de842c50b/zich_a_11815002_f0001_ob.jpg)
Table II Description of case's characteristics from DNA clusters and bivariate analysis
Fig. 2 SNA of NWT1 DNA fingerprint cluster. The yellow circles represent the cases and the red squares represent the communities. The heavy black lines represent cases reported within 2 years, while the lighter lines represent exposure between the cases exceeding 2 years.
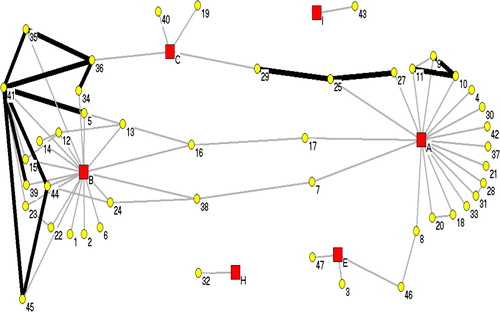
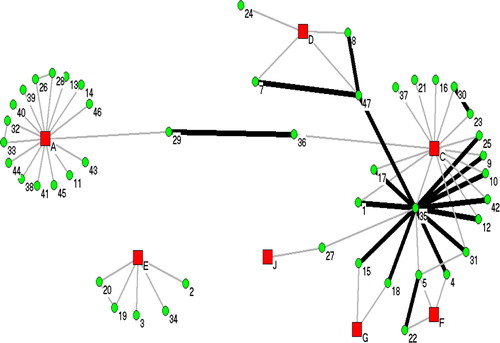
Fig. 3 SNA of NWT2 DNA fingerprint cluster. The green circles represent the cases and the red squares represent the communities. The heavy black lines represent cases reported within 2 years, while the lighter lines represent exposure between the cases exceeding 2 years.