Figures & data
Fig. 1 Map of Inuit Nunangat, 2006.
Source: Peters PA. 2012. Shifting transitions: health inequalities in Inuit Nunangat in perspective. J Rural Community Dev. 7:36–58. With permission.
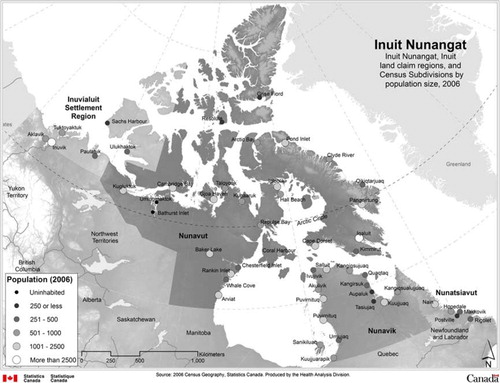
Table I Descriptive characteristics of Inuit children aged 2–5 by hunger status (never- versus ever-hungry), 2006
Table II Dietary habits of Inuit children aged 2–5 by hunger status, 2006
Table III Traditional foods consumed by Inuit children aged 2–5, by hunger status, 2006
Table IV Factors predicting parent-reported ever being hungry, Inuit children aged 2–5