Figures & data
Fig. 1 Age and gender distributions of injuries reported to the Canadian Hospitals Injury Reporting and Prevention Program (CHIRPP) from communities within the Northwest Territories (NWT) and Nunavut, 1991–2010.
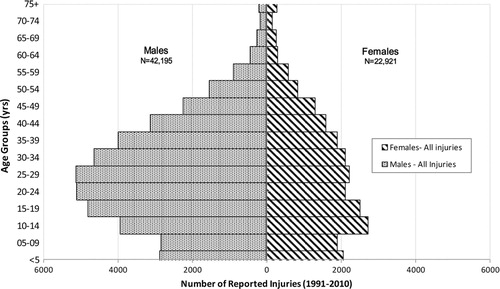
Table I Distribution of injury characteristics reported to the Canadian Hospitals Injury Reporting and Prevention Program (CHIRPP) from communities within the Northwest Territories (NWT) and Nunavut, 1991–2010
Table II Proportionate injury ratio (PIR) (Citation17) and confidence interval (95% CI) (Citation18) by gender and selected injury characteristics reported to the Canadian Hospitals Injury Reporting and Prevention Program (CHIRPP) from communities within the Northwest Territories (NWT) and Nunavut, 1991–2010