Figures & data
Table I. Minimum inhibitory concentration (MIC) endpoints used in this study (Citation17)
Fig. 1. Total antibiotic usage (Ceph+PCN+TET+macrolides+TMP/SMX) American Indian/Alaska Native persons ≥5 years of age (1992–2009).
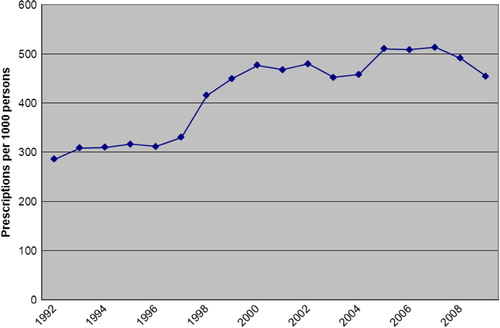
Fig. 2. Trimethoprim/sulfamethoxazole prescription rate per 1,000 American Indian/Alaska Native persons ≥5 years of age (1992–2009).
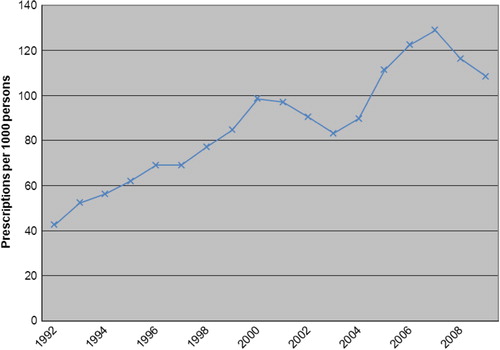
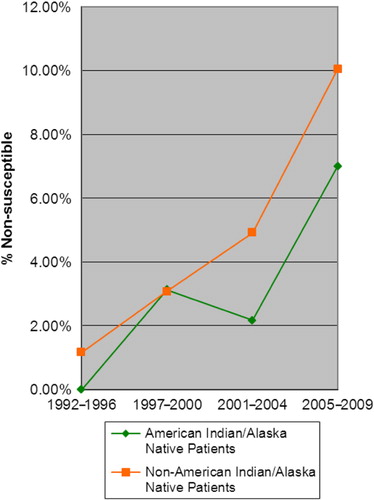
Fig. 3. TMP/SMX non-susceptibility in IPD isolates (non-PCV7 serotypes) from patients ≥5 years of age (1992–2009).
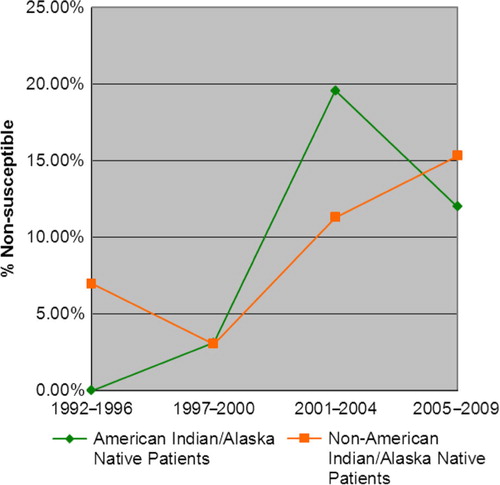
Fig. 4. Macrolide prescription rate per 1,000 American Indian/Alaska Native persons ≥5 years of age (1992–2009).
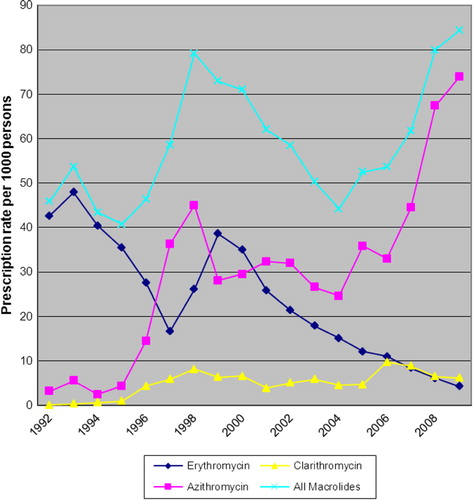
Fig. 5. Erythromycin non-susceptibility in IPD isolates (non-PCV7 serotypes) from patients ≥5 years of age (1992–2009).