
Figures & data
Fig. 1. Map of the Nenets Autonomous Okrug (http://www.raipon.org/ikdm/Regions.aspx).
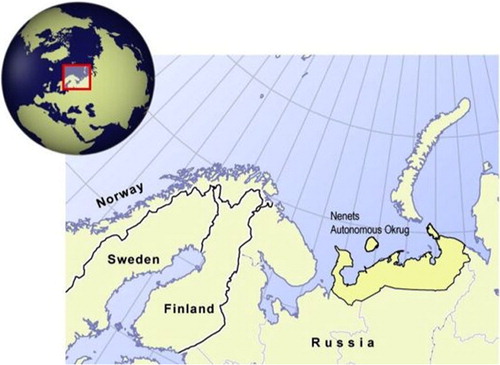
Table I. Number of suicides and suicide rates (per 100,000 PYs) by ethnicity, gender and age in the Nenets Autonomous Okrug, 2002–2012
Table II. Number of suicides and suicide rates (per 100,000 PYs) by ethnicity, residence and gender in the Nenets Autonomous Okrug, 2002–2012
Table III. Number of suicides and suicide rates (per 100,000 PYs) by ethnicity, employment status and gender in the Nenets Autonomous Okrug, 2002–2012
Table IV. Number of suicides and suicide rates (per 100,000 PYs) in the study sample aged of 10 years and older by ethnicity, education and gender in the Nenets Autonomous Okrug, 2002–2012
Table V. Number of suicides and suicide rates (per 100,000 PYs) in the study sample aged 16 years and older by ethnicity, marital status and gender in Nenets Autonomous Okrug, 2002–2012