
Figures & data
Fig. 1.1. Change in size of indigenous minority populations in Yakutia between 1989 and 2002.
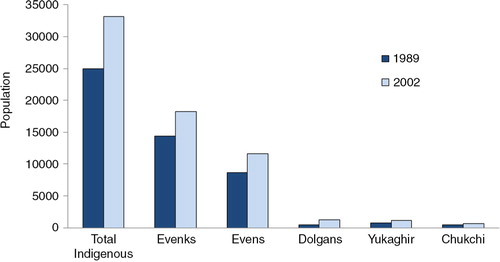
Table 1.1. The indigenous minority populations of Yakutia by rural and urban residence, 1989 and 2002
Table 1.2. Median age and distribution of indigenous minority populations in Yakutia by age group, 1989 and 2002
Table 1.3. Education level of indigenous minority populations in Yakutia, 1989 and 2002
Fig. 2.1. Map of study regions and settlements.
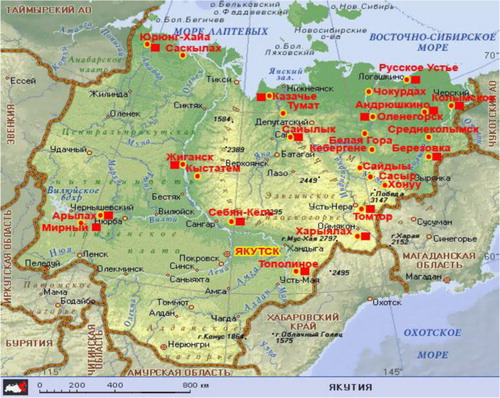
Table 2.1. Settlements and regions of participants in study on children
Table 2.2. Ethnic origin of participants in study on children
Table 2.3. Ethnic origin and place of residence of participants in study on adults
Table 2.4. Distribution of participants in study on adults by sex and age group
Table 2.5. Employment status of participants in study on adults
Table 2.6. Ethnic origin and place of residence of participants who completed questionnaire in study on adults
Table 3.1. Selected health indicators in Yakutia, 2002–2006
Fig. 3.1. Distribution of disorders in teenagers presenting to the Pediatric Center of Republican Hospital 1.
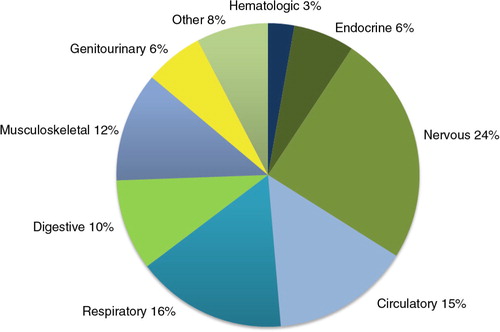
Table 3.2. Height-for-age in Yakut, Russian, Even, Evenk, Chukchi and Yukagir boys
Table 3.3. Height-for-age in Yakut, Russian, Even, Evenk, Chukchi and Yukagir girls
Table 3.4. Weight-for-age in Yakut, Russian, Even, Evenk, Chukchi and Yukagir boys
Table 3.5. Weight-for-age in Yakut, Russian, Even, Evenk, Chukchi and Yukagir girls
Fig. 3.2. Mean systolic blood pressure of Russian, Yakut and indigenous minority children in selected age groups.
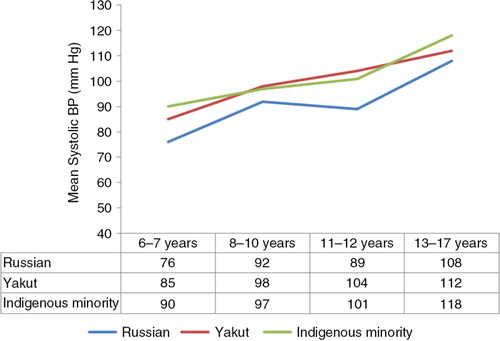
Fig. 3.3. Mean diastolic blood pressure of Russian, Yakut and indigenous minority children in selected age groups.
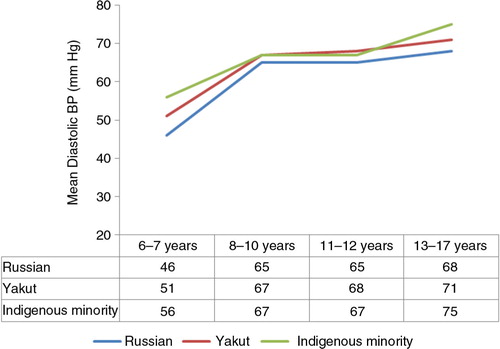
Table 3.6. Association between physical and sexual development and hormone levels in indigenous girls
Table 3.7. Association between physical and sexual development and hormone levels in indigenous boys
Table 3.8. Levels of thyroid hormones and cortisol in indigenous children in Yakutia
Table 3.9. Frequency of mutations, by ethnicity
Table 4.1. Total population (in thousands) in indigenous minority regions
Table 4.2. Population of indigenous minorities living in rural areas
Table 4.3. Birth, mortality and natural increase rate in Yakutia and indigenous minority regions
Table 4.4. Distribution of the rural population of indigenous minorities by sex and age, as of January 1, 2004
Table 4.5. Number and rate of hospital beds in indigenous minority regions
Table 4.6. Number of ambulatory clinics and medical and obstetrical centres in indigenous minority regions
Table 4.7. Number and rate of physicians and nurses in indigenous minority settlements
Table 4.8. Mean serum lipid levels and index of atherogenicity, by ethnic group and sex (±standard deviation)
Table 4.9. Prevalence of lipid metabolism abnormalities, by ethnicity
Fig. 4.1. Distribution of respondents by family size and region.
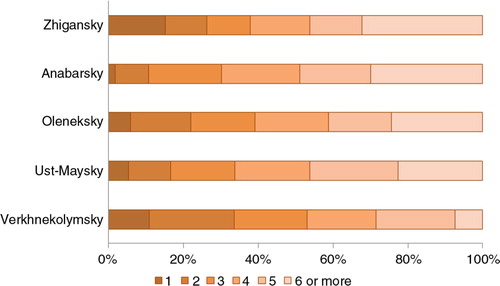
Table 4.10. Distribution of respondents by housing conditions and region
Fig. 4.2. Respondents’ evaluation of living conditions by region.
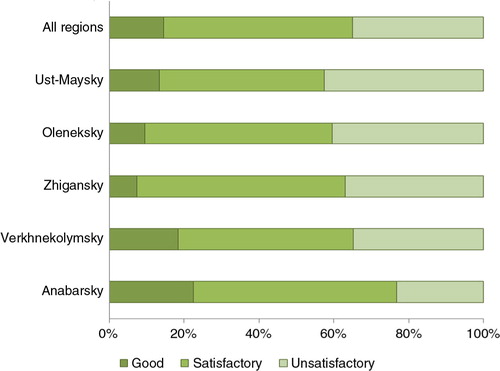
Fig. 4.3. Distribution of respondents by reason for dissatisfaction with housing, by region.
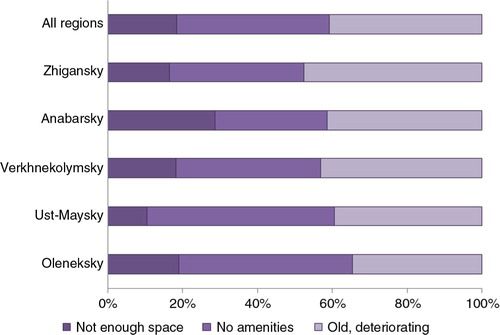
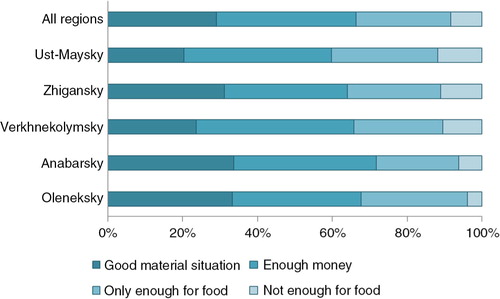
Fig. 4.4. Respondents’ evaluation of their material situation, by region.
Appendix Table 1. Rates of illness (per 100 children examined) by diagnostic category and ethnicity among children from indigenous minority settlements of northern Yakutia
Appendix Table 2. Prevalence (per 100 examined) of diseases by category and ethnic group
Appendix Table 3. Prevalence (per 100 examined) of diseases by category and region
Appendix Table 4. Distribution of respondents by selected socio-economic indicators and region