Figures & data
Table I. Suicides among Inuit in Greenland 1901–2011
Table II. Suicides and suicidal thoughts by age and sex among Inuit in Greenland 2000–2011
Fig. 1 Suicides per 100,000 person-years by age group among Inuit men and women in Greenland 1970–2011. N=1,687.
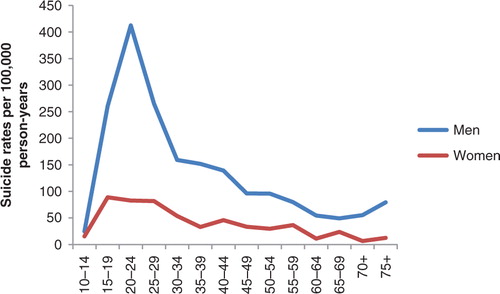
Fig. 2 Suicides per 100,000 person-years by age group in four 10-year birth cohorts. Inuit in Greenland born from 1950 to 1989. N=1,346.
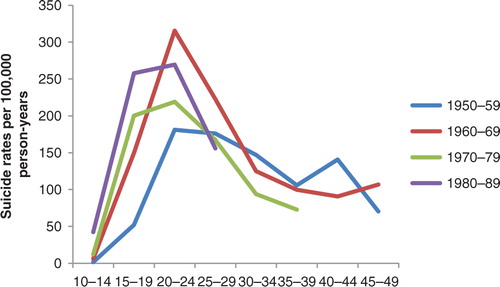
Fig. 3 Temporal trend of suicides in 4 regions of Greenland. Inuit in Greenland. Rates per 100,000 person-years standardized to World Standard Population 2000–2025. N=1,669.
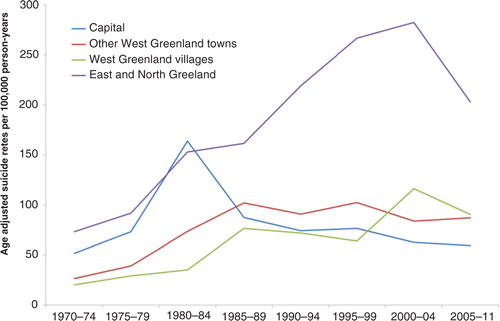
Fig. 4 Prevalence of recent (within 1 year) suicidal thoughts in 1993–1994 and 2005–2010 in 4 regions of Greenland. A: Inuit men (N=604 and 1,034, respectively); B: Inuit women (N=664 and 1,214, respectively).
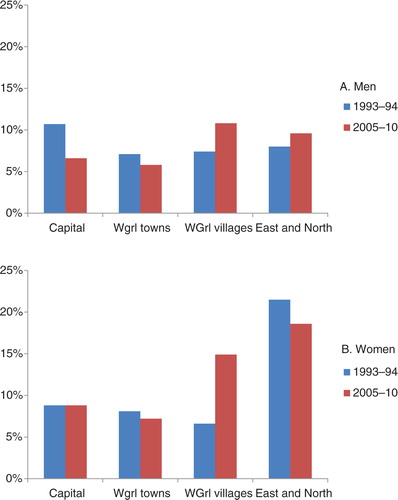
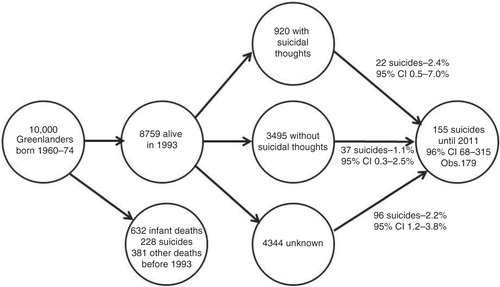
Fig. 5 Suicide experience in a fictive cohort of Inuit born 1960–1974.