
Figures & data
Table I. Mean age-standardized incidence rates of selected cancer sites in 8 Arctic States and their northern regions, 2000–2009
Fig. 1. Age-standardized incidence rates of lung cancer among men and women in the Arctic States and their northern regions, 2000–2009. Note: AO=autonomous okrug.
All 8 Arctic States (in capital letters) and most of their northern regions are included in the chart – blue refer to Russia and its northern regions, yellow to the Nordic countries and their northern regions, red to Canada and USA and their northern regions, and green to Greenland.
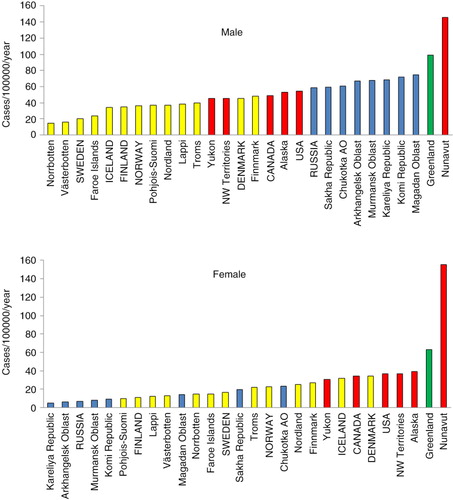
Fig. 2. Age-standardized incidence rates of cervical cancer among women in the Arctic States and their northern regions, 2000–2009.
Note: AO = autonomous okrug.
All 8 Arctic States and most of their northern regions are included in the chart – blue refer to Russia and its northern regions, yellow to the Nordic countries and their northern regions, red to Canada and USA and their northern regions, and green to Greenland.
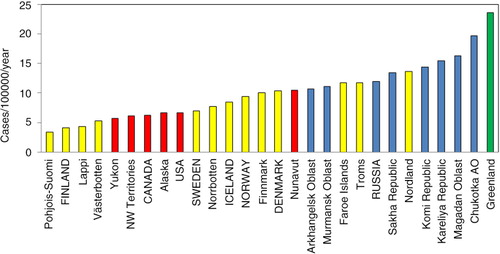
Table II. Age-standardized incidence rates among Circumpolar Inuit by cancer site, sex and time period
Fig. 3. Time trend in lung cancer incidence among circumpolar Inuit and Athabaskan/Dene, 1989–2008.
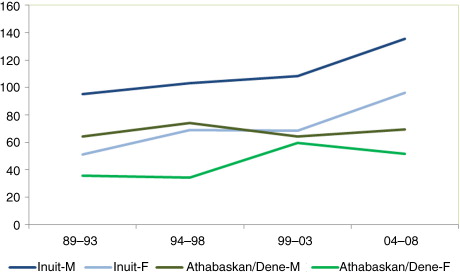
Fig. 4. Time trend in colorectal cancer incidence among circumpolar Inuit and Athabaskan/Dene, 1989–2008.
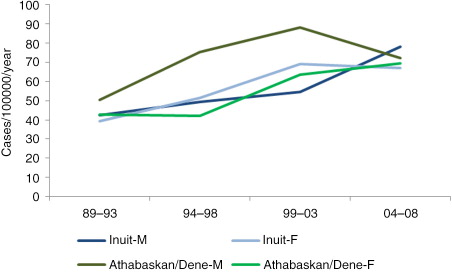
Fig. 5. Time trend in breast and cervical cancer incidence among circumpolar Inuit and Athabaskan/Dene women, 1989–2008.
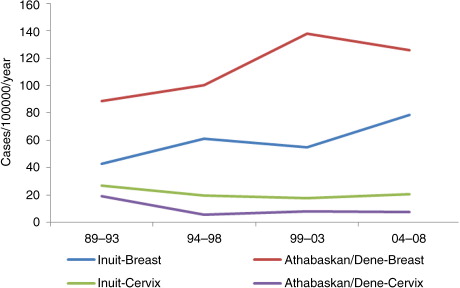
Fig. 6. Risk of cancer by site among circumpolar Inuit relative to the GLOBOCAN world average.
Note: Bars above the 1.0 line indicates excess risk among Inuit, whereas bars below the 1.0 line indicates reduced risk. Horizontal axis is in logarithmic scale.
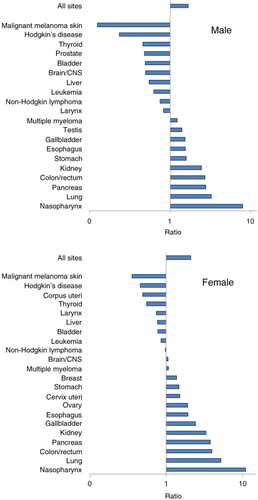
Fig. 7. Lung cancer incidence: Circumpolar Inuit and Athabaskans/Dene compared to global regions.
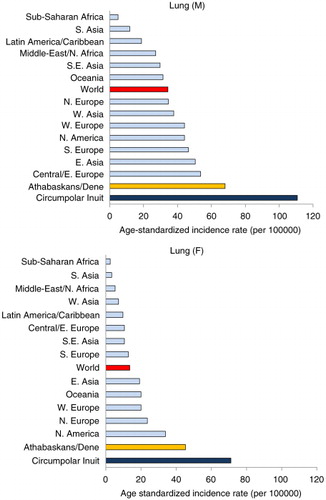
Table III. Age-standardized incidence rates among Athabaskans/Dene by cancer site, sex and time period
Fig. 8. Risk of cancer by site among Athabaskans/Dene relative to the GLOBOCAN world average. Note: Bars above the 1.0 line indicates excess risk among Athabaskans/Dene, whereas bars below the 1.0 line indicates reduced risk. Horizontal axis is in logarithmic scale.
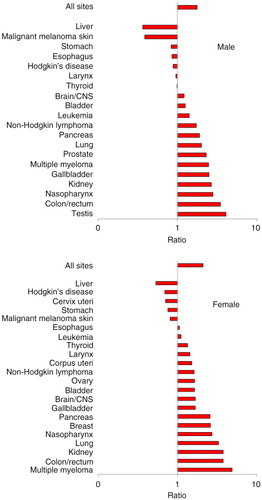
Table IV. Risk of cancer by site among Sami in Norway, Sweden and Finland relative to non-Sami in the same regions
Fig. 9. Proportion of non-smokers among the adult population in selected Arctic indigenous populations. Note: Based on data in Results Table 288 of the Survey of Living Conditions in the Arctic www.arcticlivingconditions.org [cited 2014 Dec 20].
![Fig. 9. Proportion of non-smokers among the adult population in selected Arctic indigenous populations. Note: Based on data in Results Table 288 of the Survey of Living Conditions in the Arctic www.arcticlivingconditions.org [cited 2014 Dec 20].](/cms/asset/a16166ce-a532-4d7a-ba3e-5f65fad41beb/zich_a_11821011_f0009_ob.jpg)