
Figures & data
Table I. Concentrations of POPs and metals in Yup'ik maternal blood from Alaska
Table II. Blood concentrations of POPs and metals in men and women across the Canadian Arctic
Table III. Time series of POPs and metals concentrations in pregnant Inuit women from Nunavik, Canada
Table IV. Concentrations of PCBs and OCs (µg/kg plasma lipid) and metals (µg/L whole blood) among Inuit men and women in Greenland by age groups (years)
Table V. Concentrations of POPs and metals in pregnant women from different regions in Greenland for 2010–2011 and 2013
Table VI. Trends in blood concentrations of POPs (µg/kg plasma lipid) in pregnant Icelandic women in their third trimester
Table VII. Time series of blood POPs concentrations from the Faroe Islands Cohort 1 (1986–1987)
Table VIII. Time series of blood POPs concentrations from the Faroe Islands Cohort 3 (1998–2000)
Table IX. Time series of blood POPs concentrations from the Faroe Islands Cohort 2 (1994–1995)
Table X. Time series of blood POPs concentrations from the Faroe Islands Cohort 5 (2007–2009)
Table XI. Concentrations of PCBs and OCs in pregnant women (early pregnancy) from northern Norway (mean parity=0.9 (0–4))
Table XII. Serum concentrations of PFCs (µg/L) in the northern Norway MISA study group (mean parity=0.9 (0–4))
Fig. 1. Trends in POPs concentrations in breast milk samples from Swedish first-time mothers (µg/kg lipid). Samples were collected 3 weeks after delivery. Data are presented as median concentrations (Citation34).
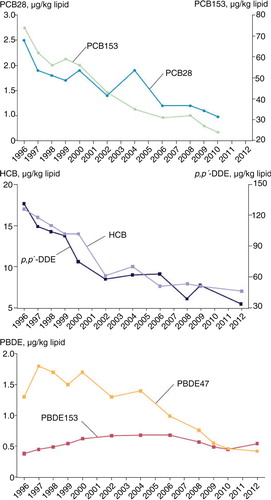
Fig. 2. Trends in PFC concentrations (µg/kg pooled serum) in blood samples from nursing Swedish first-time mothers; blood samples were taken 3 weeks after delivery. Three pools per year were analysed, with serum from 5 to 25 individuals in each data pool. Data are presented as geometric means (Citation33,Citation34).
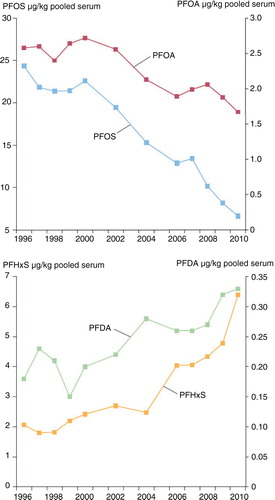
Table XIII. Median concentrations of Hg in blood (µg/L) in pregnant women in northern, western and southern Sweden
Table XIV. Trends of contaminants in breast milk from first-time mothers in southern Finland (non-Arctic), central Finland (non-Arctic) and northern Finland (Arctic)
Table XV. Maternal, cord and child blood concentrations of metals from coastal Chukotka, Russia (2001–2002 and 2007)
Table XVI. Concentrations of POPs in pregnant women, non-pregnant women and men in the Pechenga District of Murmansk Oblast, 2013–2014
Fig. 3. Circumpolar concentrations of PBDEs, PFOS, PCB153, p,p’-DDE, Hg and Pb. Unless otherwise indicated, POPs and PBDEs are presented in µg/kg plasma lipid, PFCs in µg/L and metals in µg/L whole blood. Data for Alaska, Faroe Islands, Sweden (except metals) and coastal Chukotka (Russia) are derived from maternal blood. Data for the Inuvialuit Settlement Region (NWT, Canada), Nunavut (Canada) and Nunatsiavut (NL, Canada) are derived from the blood of women of childbearing age. Data for Nunavik (QC, Canada), Greenland, Iceland, Norway, Sweden (metals only) and the Pechenga district (Russia) are derived from the blood of pregnant women. Data for Sweden (PBDE47, PCB153 and p,p’-DDE) and Finland are derived from breast milk.
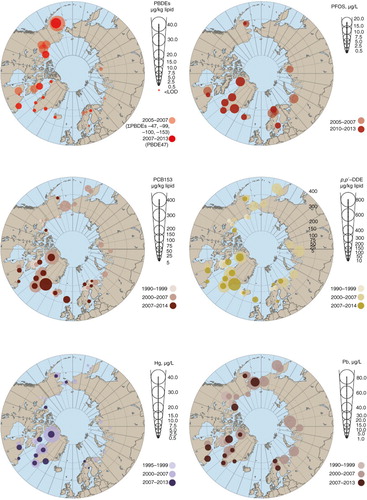
Table XVII. Concentrations of selected contaminants across Arctic countries, compared with biomonitoring in non-Arctic areas