Figures & data
Figure 1. The main flowchart of the binary tree algorithm that takes samples of the accelerometer and evaluates the variance to classify activity.
Figure 2. Histogram of accelerometer variances (in log scale). The jumps are noted as the adaptive thresholds to distinguish different physical activities.
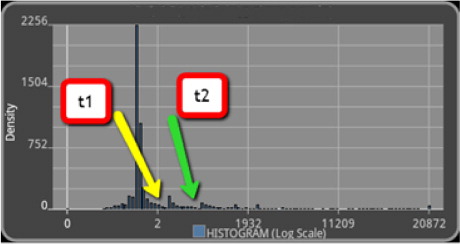
Figure 3. Average sampling time (top) and its variance (bottom) obtained for all four different sampling periods provided by an Android operating system. The sampling rates arranged from lowest to highest: Normal, UI, Game, and Fastest, respectively. The average sampling times are not affected by different activities, but the variation of the sampling times with activities are clearly noted.
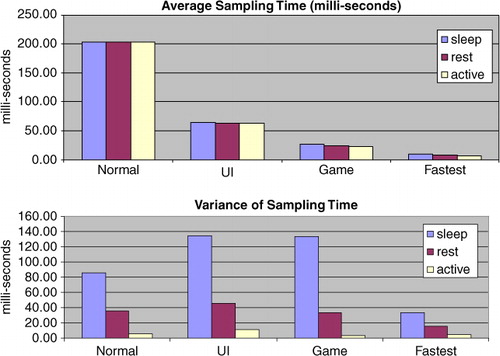
Figure 4. Average time for 1% of battery consumption over four different sampling rates clearly shows that faster sampling rates results in lower battery times.
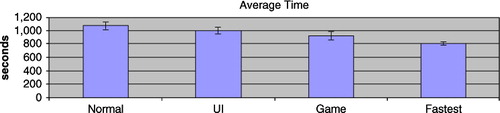
Figure 5. Average time for 1% of battery consumption over four different duty cycles shows that higher duty cycles results in lower battery times. However, more variation in battery times is clearly noted in lower duty cycles.
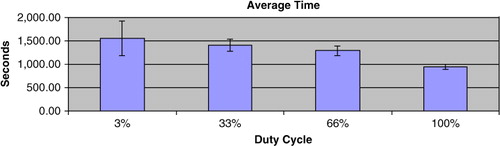
Table I. Step counts obtained with pedometer and manual count
Table II. Percentage of step count error with various affecting factors compared with pedometer