Figures & data
Fig. 1 T2-weighted cross-sectional MRI image of the left thigh showing edema and breakdown of muscle architecture.
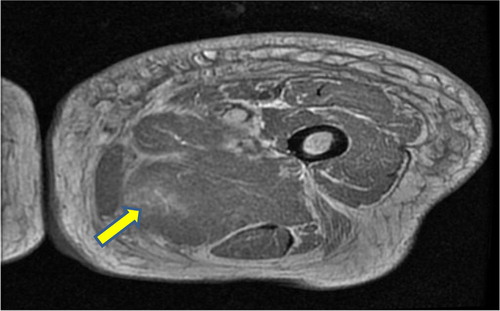
Fig. 2 T2-weighted coronal MRI image of the lower extremities showing edema and breakdown of muscle architecture of the left thigh.
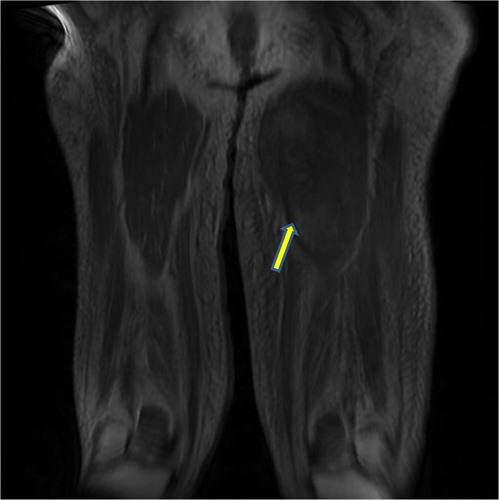
Fig. 3 Necrosis of individual muscle fibers (yellow arrow) with edema (blue arrow) in between fibers characteristic of diabetic myonecrosis.
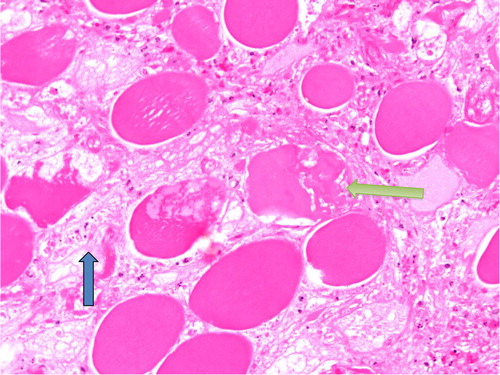
Fig. 4 Showing proliferative myositis with expanded myxoid connective tissue with inflammatory cells (yellow arrow). The appearance is also described as checkerboard appearance.
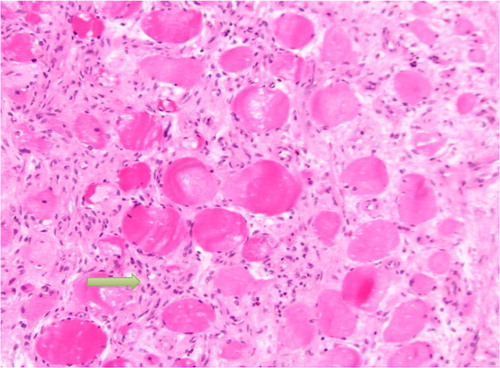
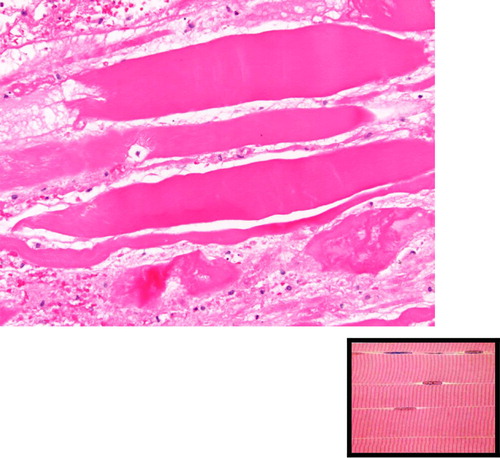
Fig. 5 Longitudinal sections showing loss of striation, in comparison to the normal appearance shown in the bottom right corner.