Figures & data
Fig. 1. Selection of a shRNA for specific inhibition of mouse Rab27a. A, Effect of 2 different shRNA sequences specific for Rab27a (sh27a2 and sh27a4) on Rab27a and Rab27b expression, measured by qRT-PCR. In each experiment, Rab27 expression in shRab27-expressing cells is compared to expression in cells expressing a control shRNA (Scr). Individual results of 3 (sh27a4) or 7 (sh27a2) experiments are shown. Both sh27a2 and sh27a4 significantly decrease Rab27a expression, but sh27a4 also increases Rab27b expression. ***p < 0.01, 1-way ANOVA, Dunnett's post-test. B, Stable expression of sh27a2 induces downregulation of Rab27a at the protein level, as shown by Western blotting on total cell lysate (left panel). Actin is shown as loading control. Individual values of arbitrary units of Rab27a/actin band intensity in 2 independent experiments is shown (right panel). In each experiment, arbitrary units obtained for Scr cells are considered as 100%.
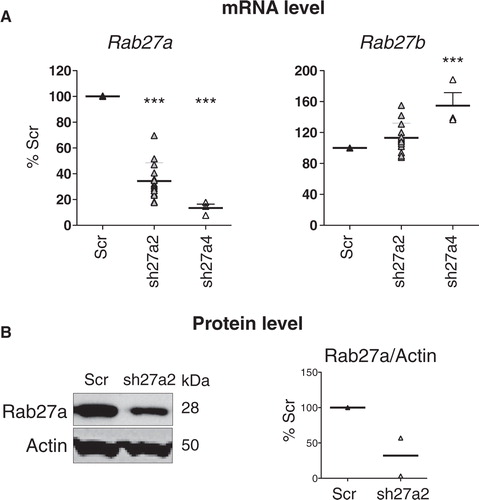
Fig. 2. Inhibition of Rab27a decreases secretion of a subset of exosomal markers. A, Western blot characterization of exosomes (Exo) secreted by the same number of control (Scr) or shRab27a-expressing 4T1 cells (sh27a), i.e. corresponding to 2–3 µg of total proteins. 30 µg of total cell lysates (cell) were analysed in parallel. Six different exosomal markers (CD63, Alix, Tsg101, Hsc70, CD9 and Mfge8) and a negative control (gp96) are shown. B, Quantification of the amount of each marker in exosomes obtained from shRab27a-expressing cells, as compared to control cells (individual results from 5 independent experiments are shown). *p < 0.05, **p < 0.01, paired t-test.
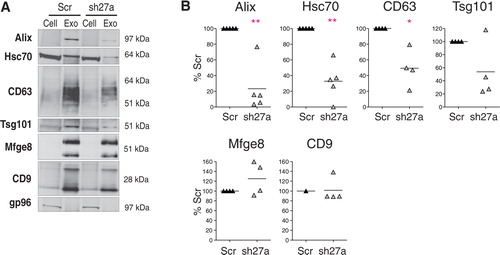
Fig. 3. CD9, CD63 and Mfge8 display subtly different patterns after floatation on sucrose gradients. A, The 100,000 g pellet recovered from Scr-4T1 cell conditioned medium was allowed to float into a sucrose gradient. The resulting fractions were analysed by Western blot using antibodies to Mfge8, CD63 and CD9. Density of each sucrose fraction in g/ml, measured by refractometry, is indicated above the gel. Mfge8, CD9 and CD63 float at the expected sucrose density of exosomes (1.11 g/ml and mostly 1.14 g/ml). Mfge8 also floats at 1.09 g/ml, whereas a large part of the tetraspanins also floats in high density fractions (1.26–1.29 g/ml). B, Same analysis performed with 100,000 g pellets obtained from shRab27a-expressing 4T1 cells. CD9 is more abundant in the 1.11 g/ml than in the 1.14 g/ml fraction and is also abundant in the high density fractions.
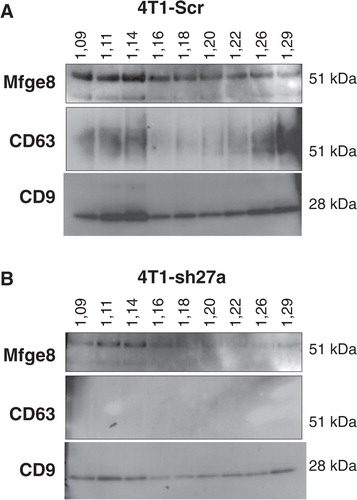
Fig. 4. CD9 is expressed on different types of vesicles present in the 100,000 g pellet. A–C, one representative Immuno-EM analysis of exosomes secreted by control (Scr) or sh27a-4T1 cells, labelled with anti-CD9 (10 nm). A, Representative image of exosomes from 4T1-Scr. Two populations of vesicles can be observed, displaying (arrows) or not (stars) the typical cup-shaped morphology. Diameter of the latter vesicles is below 50 nm. All vesicles are positive for CD9. Scale bar: 200 nm. B, The size of each individual vesicle was measured on EM pictures. The mean size of vesicles secreted by 4T1-sh27a is decreased (left panel, ***p < 0.001), due to a decrease in the proportion of vesicles larger than 50 nm (right panel). C, Quantification of the size and number of CD9 particles on isolated vesicles obtained from Scr-4T1 (left) or sh27a-4T1 cells (right). D, Quantification of the number of CD9 particles per individual vesicles, classified according to their size (30–50 nm, 51–100 nm, 101–200 nm). Results pooled from 2 individual experiments performed on vesicles from 4T1-Scr are shown. Mean + SD is displayed.
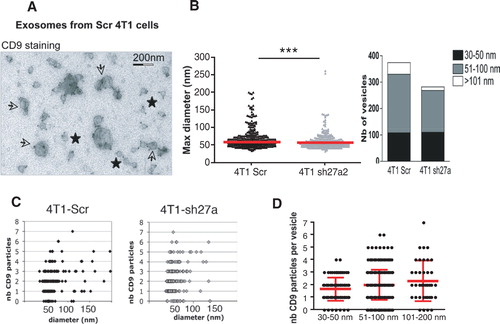
Fig. 5. Inhibition of Rab27a does not affect secretion of CD9 and Mfge8 in vesicles pelleted at 10,000 g. A, Western blot characterization of larger vesicles pelleted at 10,000 g (MV) secreted by 16×106 control (Scr) or sh27a-expressing 4T1 cells, as compared to the 100,000 g pellet (Exo) secreted by 15×106 Scr cells in the same experiment. One representative Western blot showing the presence of CD9 and Mfge8 in MV, whereas CD63 is hardly detected. B, Quantification of CD9 and Mfge8 in the 10,000 g pellet obtained from sh27a-expressing cells, as compared to control (Scr) cells (individual results from 4 independent experiments). C, Immuno-EM analysis of the 10,000 g pellet after staining with anti-CD9. CD9 is present on vesicles larger than 200 nm as well as on a few exosome-sized vesicles.
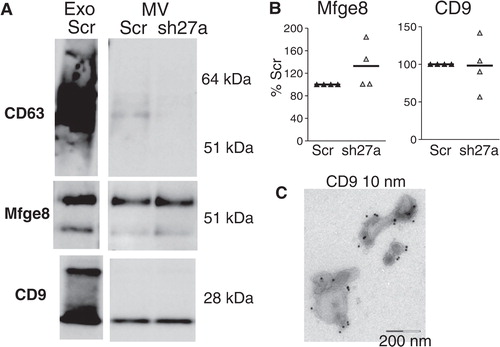
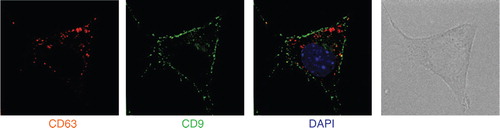
Fig. 6. CD9 and CD63 are not present in the same intracellular locations. 4T1 cells were analysed by deconvolution microscopy after staining with anti-CD9 (green) or anti-CD63 (red). Position of the nucleus is shown by DAPI staining (blue). CD9 is mainly expressed in small patches at the cell surface, whereas CD63 accumulates in intracellular compartments.